Alert Rule Creation
Data Pipeline & Dataset Monitoring
Key Outcomes
What the Project Delivered
Self-serve alert creation
The redesigned flow enabled data engineers to set up alerts independently - removing the reliance on customer success support that had been a consistent blocker in the original experience.
Multi-asset support
Introduced the ability to set alerts across multiple datasets and pipelines in a single action - a workflow that previously required creating alerts one by one.
Duplicate alert prevention
Added proactive duplicate detection to the creation flow, reducing alert spam and the CS tickets it generated. Users could now see if a similar alert already existed before creating a new one.
Research-led sprint cycle
Introduced competitor analysis and iterative user feedback into a sprint cycle that had neither before. The process continued after I joined - a systemic change, not a one-off project.
Databand Alert System
Overview
Databand (acquired by IBM) is a proactive data observability tool for data engineers that helps detect and resolve data issues. The main value Databand gives to its customers is catching bad data before it impacts the business.
Databand's alert system is the core engine that customers use to keep track of their moving data. This is why the alert definition editor is a very strategic and important part of the Databand system. By setting alert rules, customers can choose which metric and what data or pipelines processes they want to monitor.
When I came to Databand, the UX of creating an alert was one of the most painful experiences, and at the same time, one of the most challenging products.
Goals
High Level Goals
Product Goals:
- Supporting more alert types.
- More users would create more alerts without the help of Databand's customer success department.
- Creating alerts for multiple assets - Pipelines, tasks, or datasets.
- Setting alerts on data.
- Setting alerts on column level.
UX Roadmap:
- Creating an alert should be easy, and users should be able to do it alone.
- Simplify as much as possible the complexity of setting alerts on different assets and processes.
My Role
Full Ownership, Start to Finish
I was the lead designer for the alert creation experience throughout my time at Databand, owning the full design process across 7 iterative releases. This wasn't a single sprint handoff - it was a sustained design effort that evolved as user needs, technical capabilities, and business priorities changed over time.
I ran multi-channel user research (customer support analysis, user interviews, Smartlook session recordings, and demo observations), defined the UX strategy and requirements with the PM, created concepts from lo-fi wireframes through pixel-perfect specs, ran usability tests with real customers, and collaborated closely with the engineering team throughout development and QA. I also introduced the competitor research and iterative feedback practice into the team's sprint cycle - a process that didn't exist before I joined.
Research
Users' Research
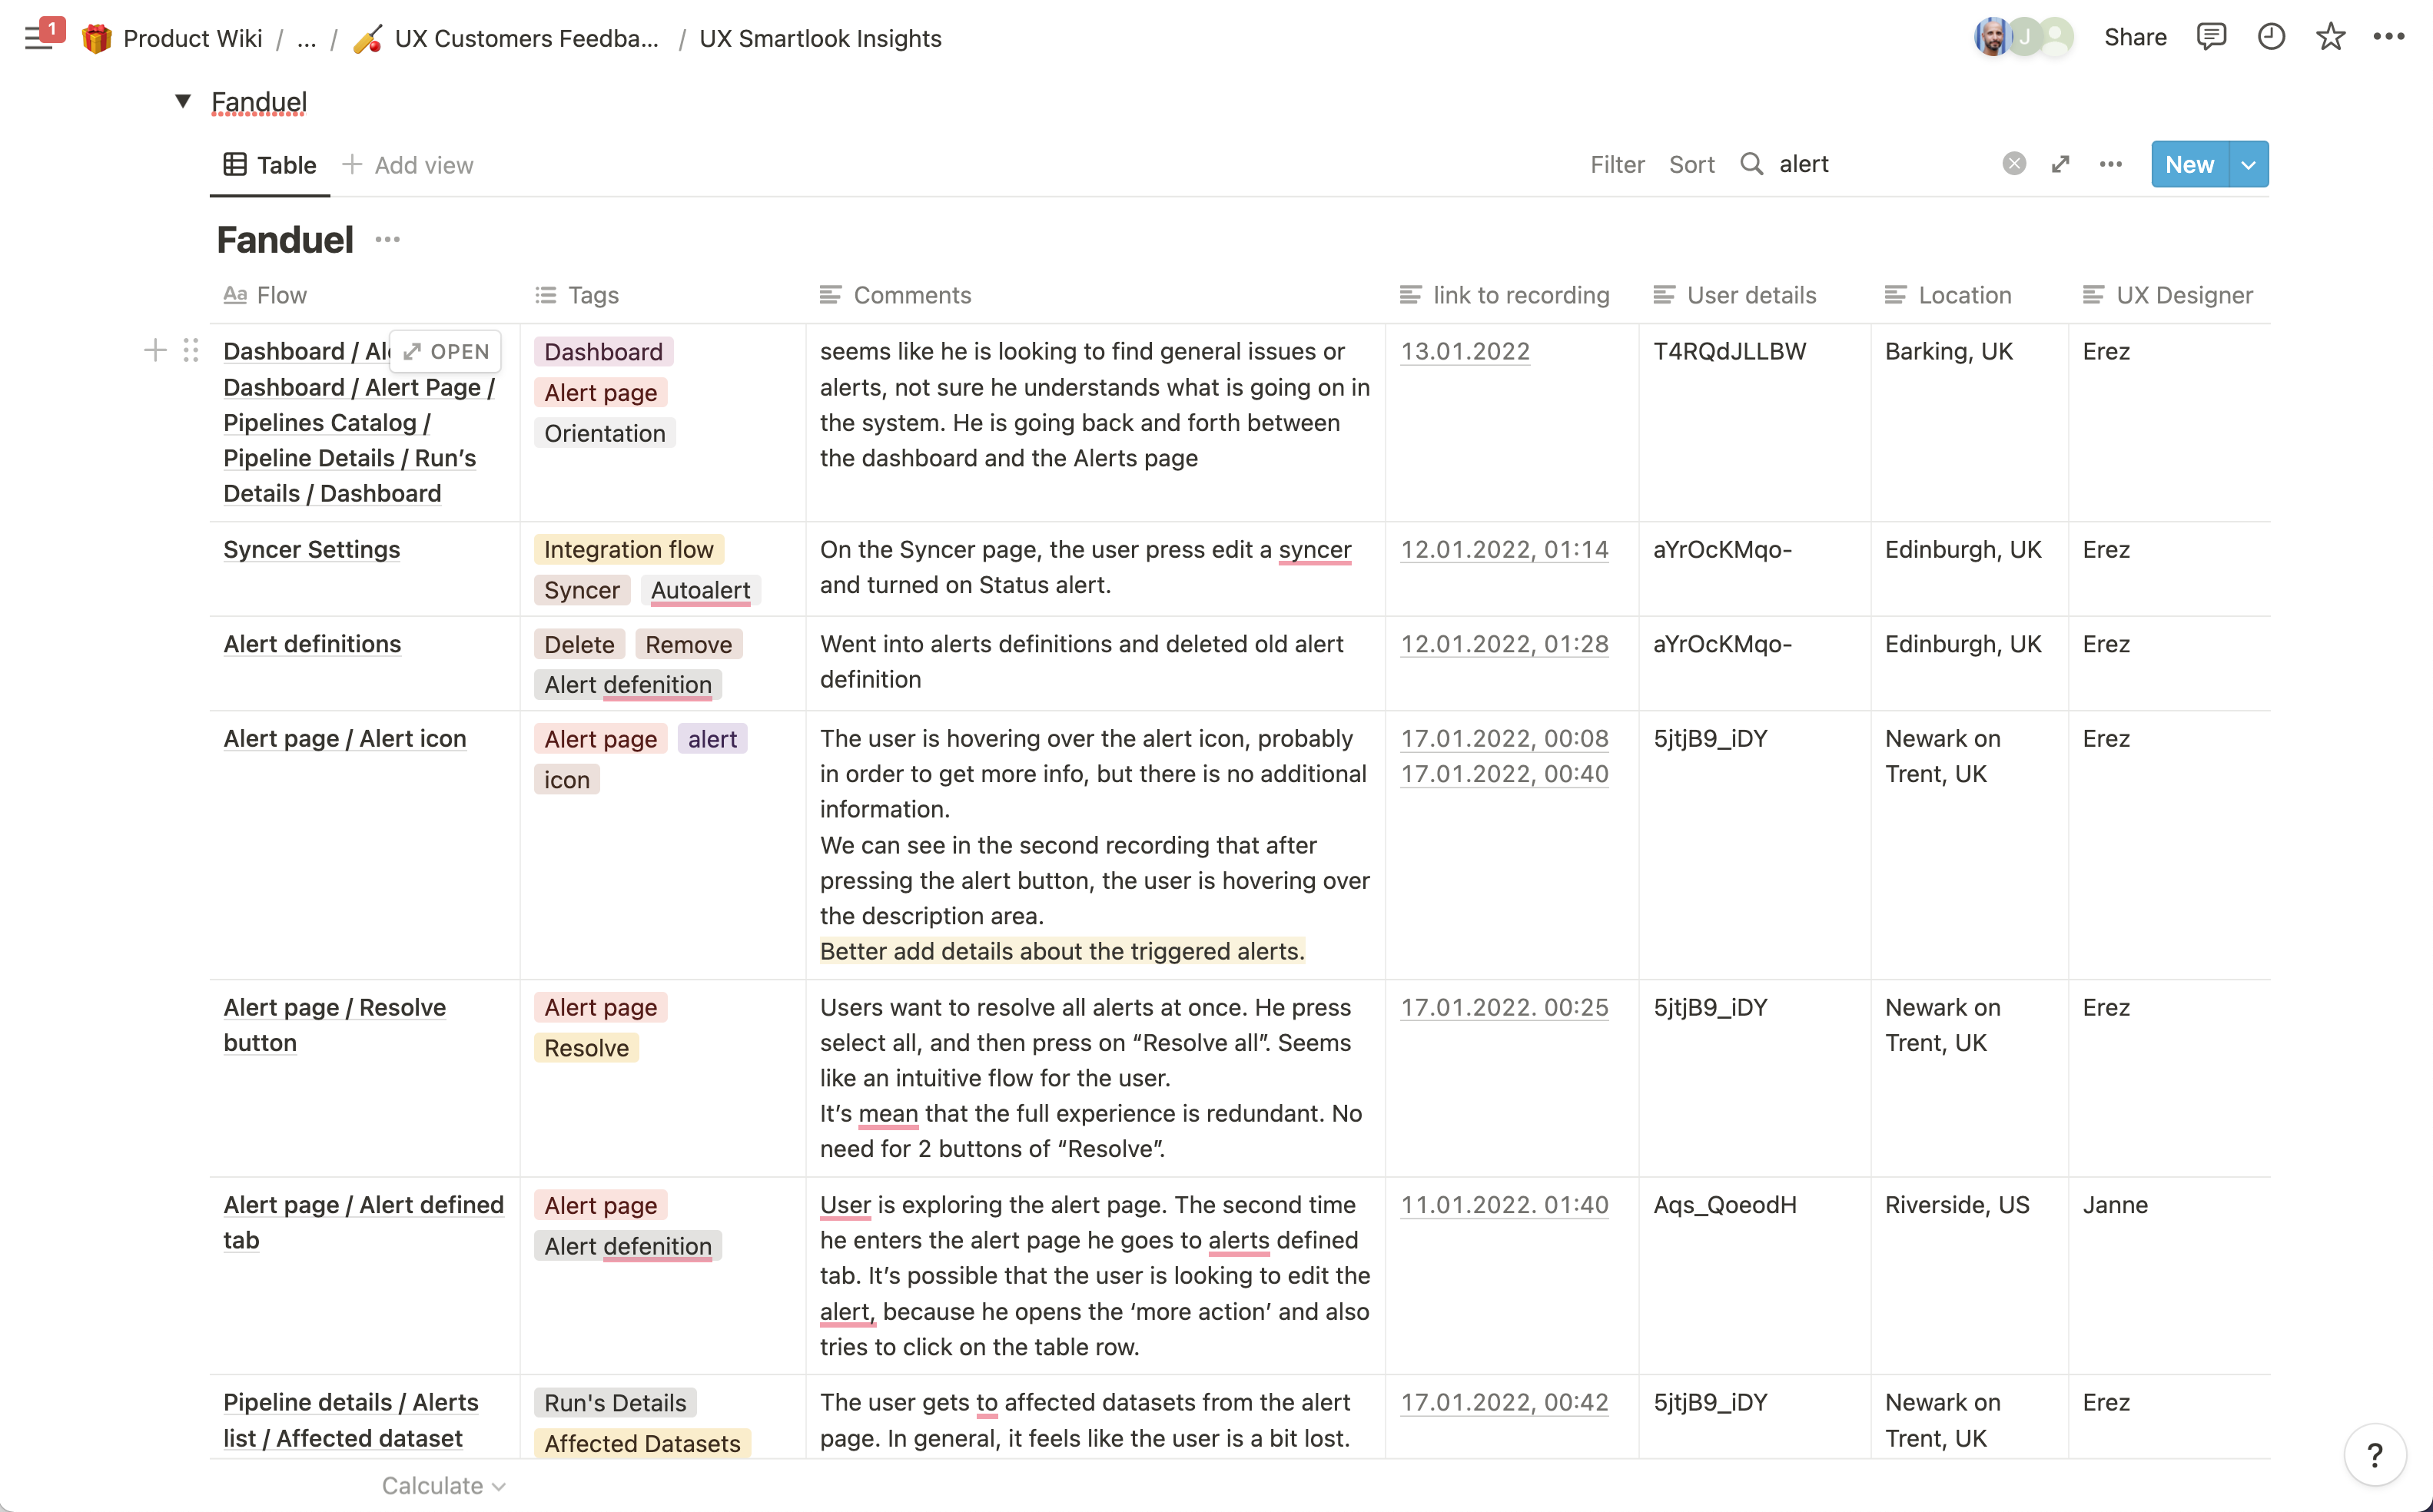
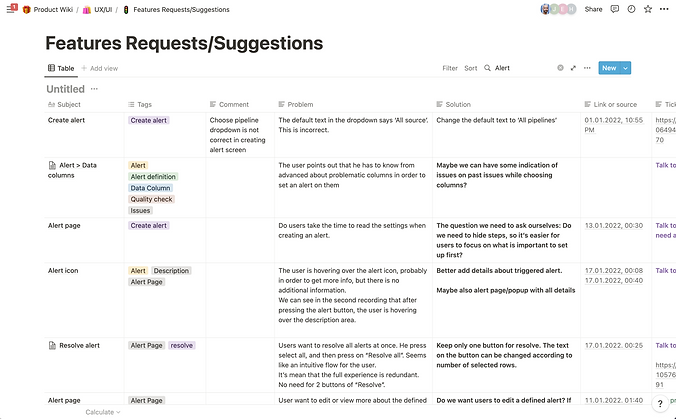
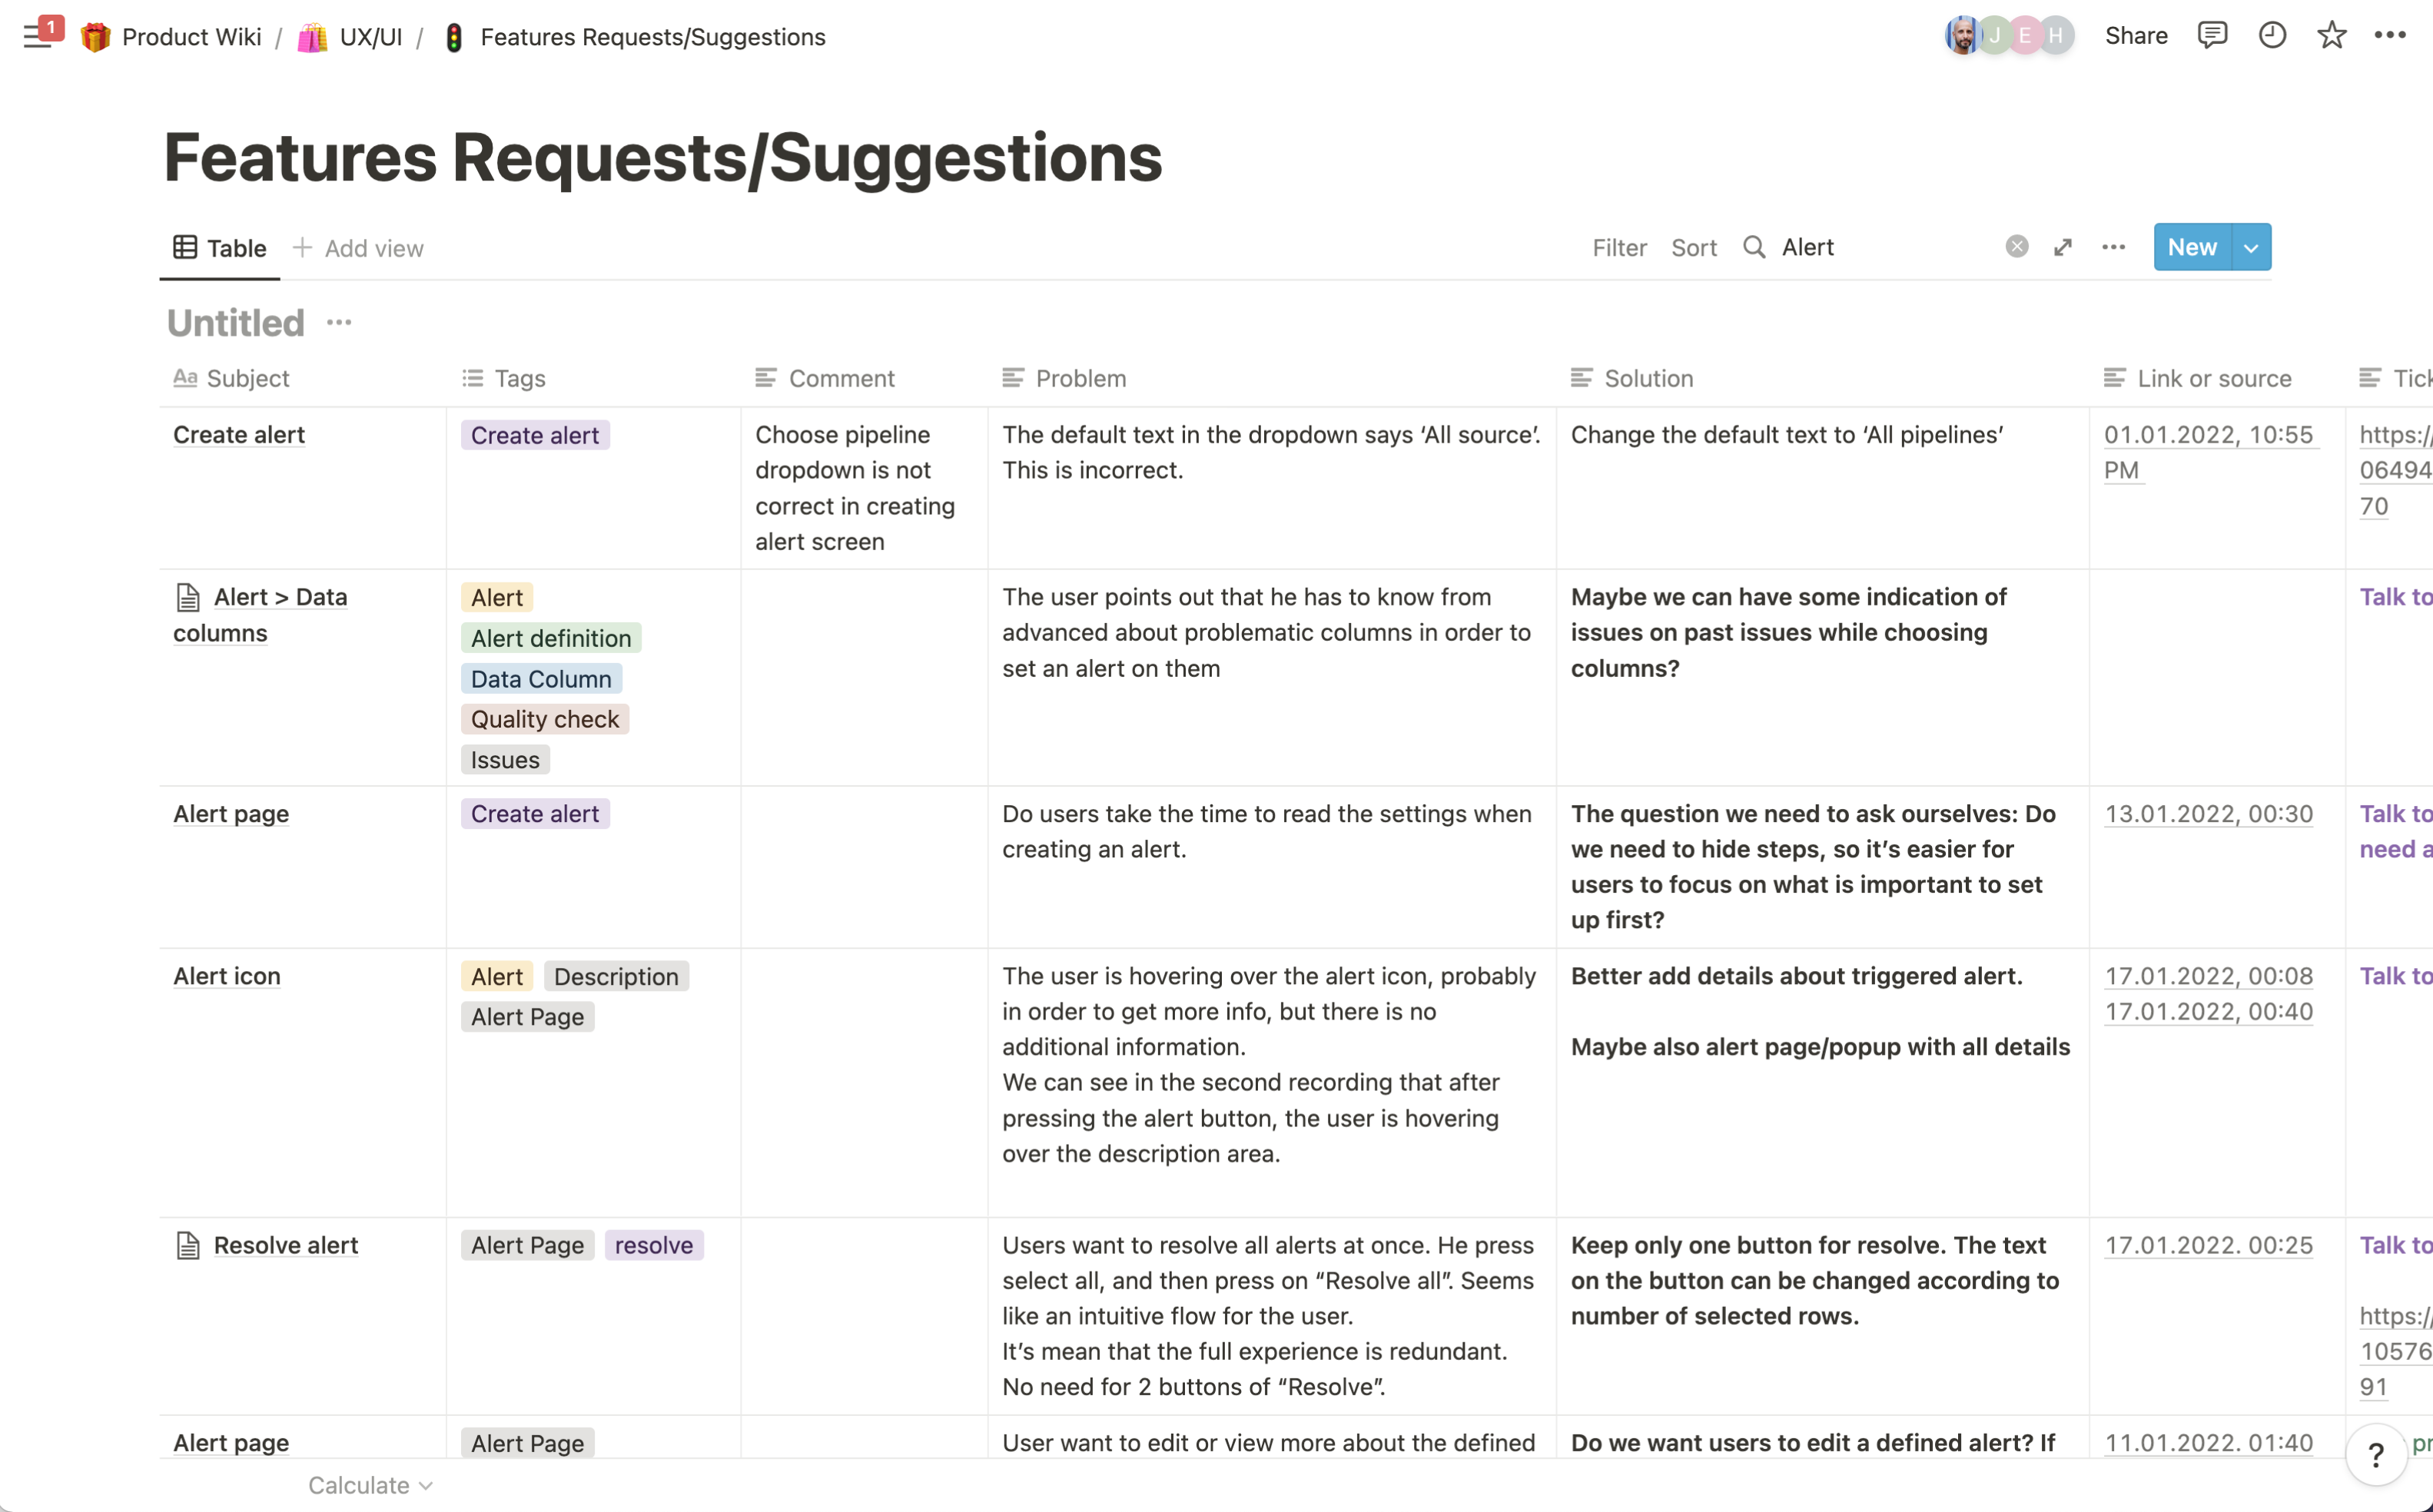
Learning how our users were experiencing the old alert creation editor was through 4 main channels: customer support, user interviews, watching recordings of demos for potential users, and watching user recordings on Smartlook.
Main Findings:
- Users don't know where to start from.
- The old experience is hard to understand.
- Lack of confidence in the UI.
- Setting up an alert is too complex for users to do themselves - they eventually ask for help from customer success.
- There is no clear hierarchy in the UI.
Research
Competitors Research
In order to understand how to design the best and optimal experience for setting an alert on data and pipelines, I was researching direct and indirect competitors, trying to understand how others are answering similar challenges that Databand's users are facing, what kind of possible features we can use, and looking for UX/UI solutions and patterns that can be used as reference or inspiration.
Main Findings:
- It is common to start creating alerts from a preset.
- The process of defining an alert is split into several steps.
- Conversational UX for setting the alert rule.
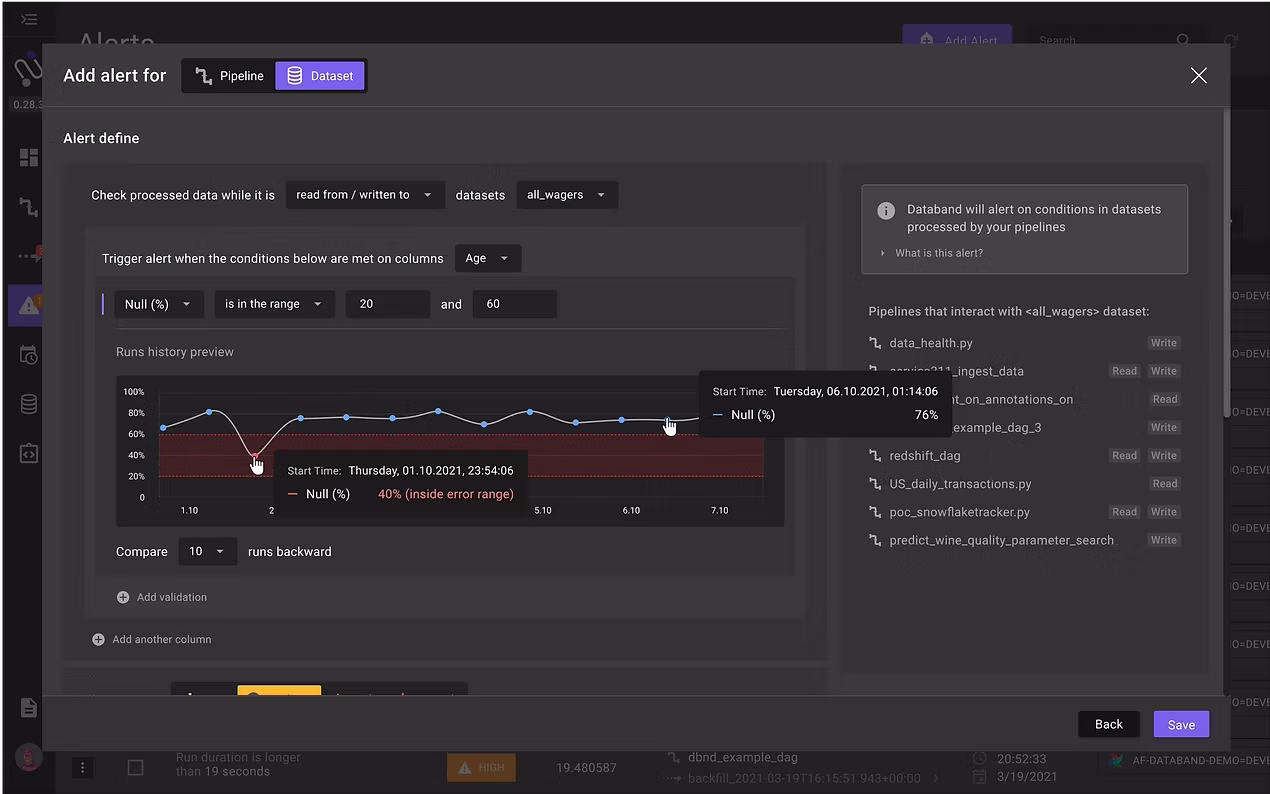
- It is common to display a preview of past data (if available), to help users choose correct trigger values.
- Choosing stakeholder receiver and platform, to be notified in case of a rule breach.
- It would be nice to have some testing action.
- There is a popular UX pattern where setting the alert is done as part of a conversational experience.
- Another pattern: an "If condition" structure.
Ideation
The Vision for Creating Alert Experience
The goal was to design an agile experience that can grow according to the complexity and additional alerts over time.
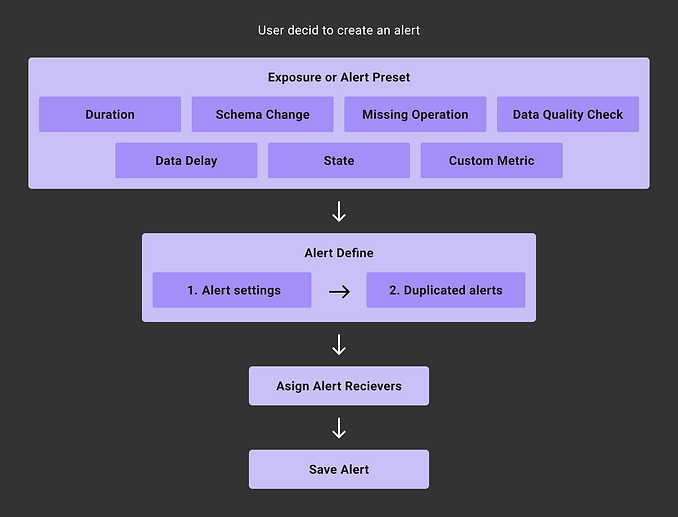
We knew that for the first iteration we would add a Data Delay alert, so I used this scenario to create a low-fidelity wireframe flow to brainstorm and share ideas inside the product team and get feedback from customer success.
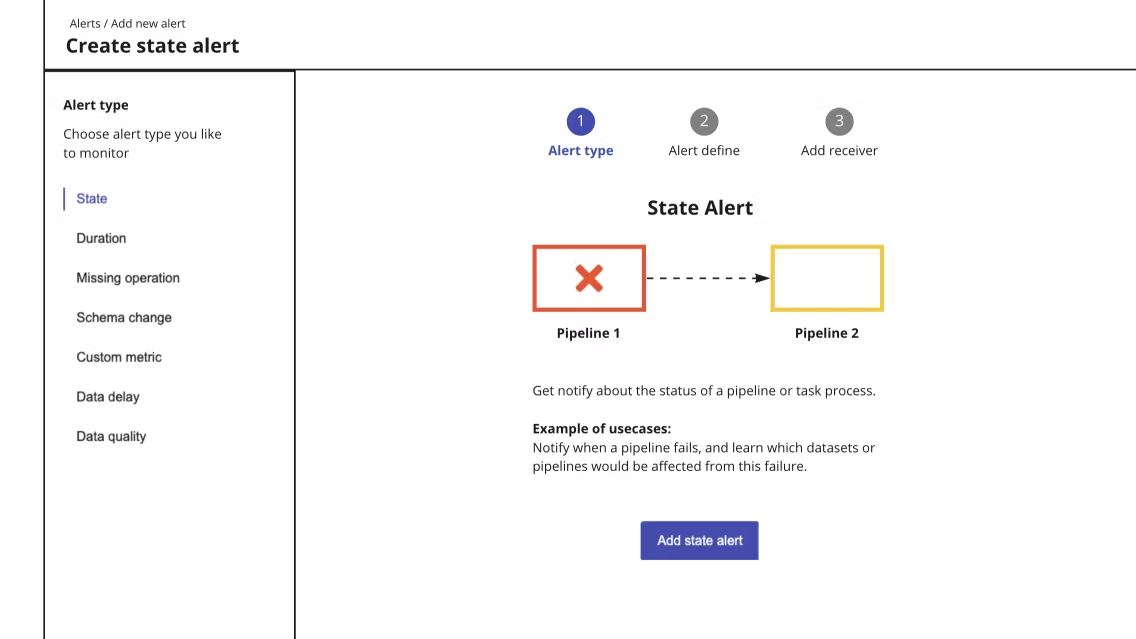
Iteration No.1
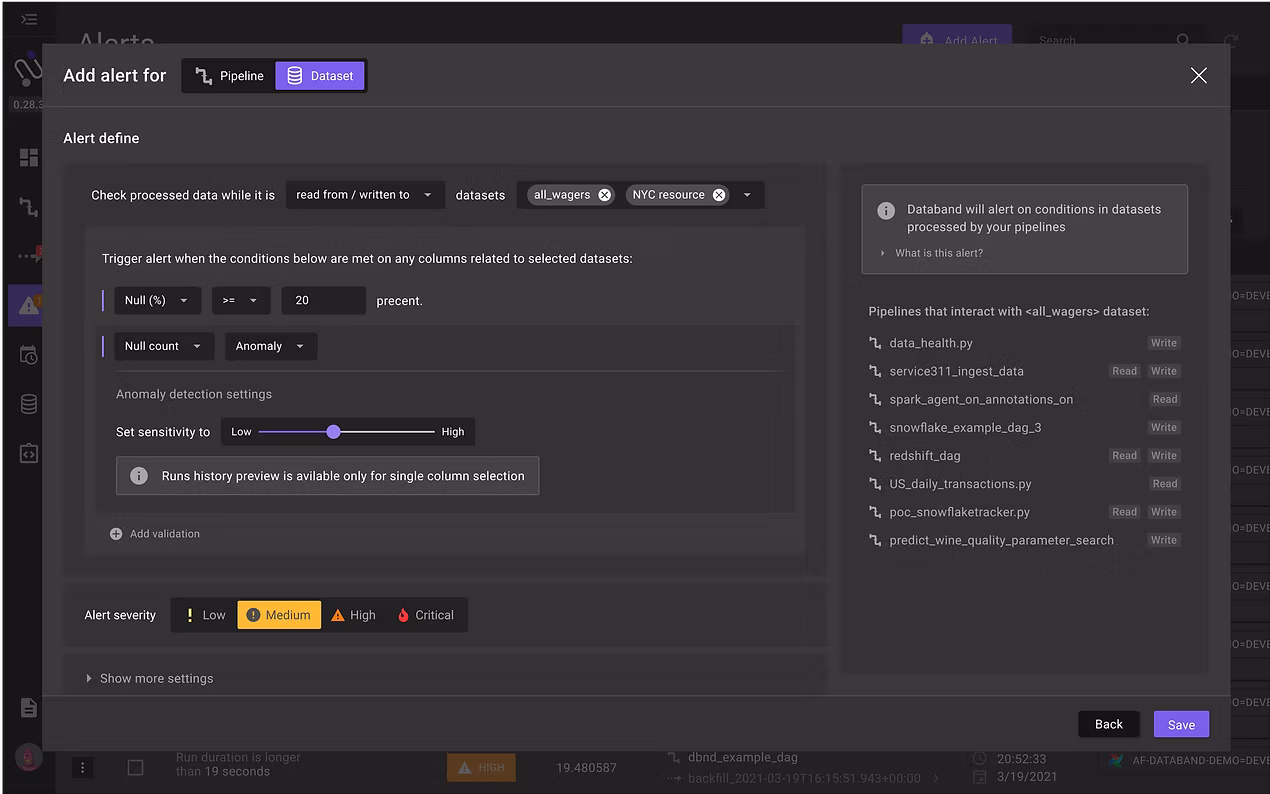
Learn about Data Quality Issues
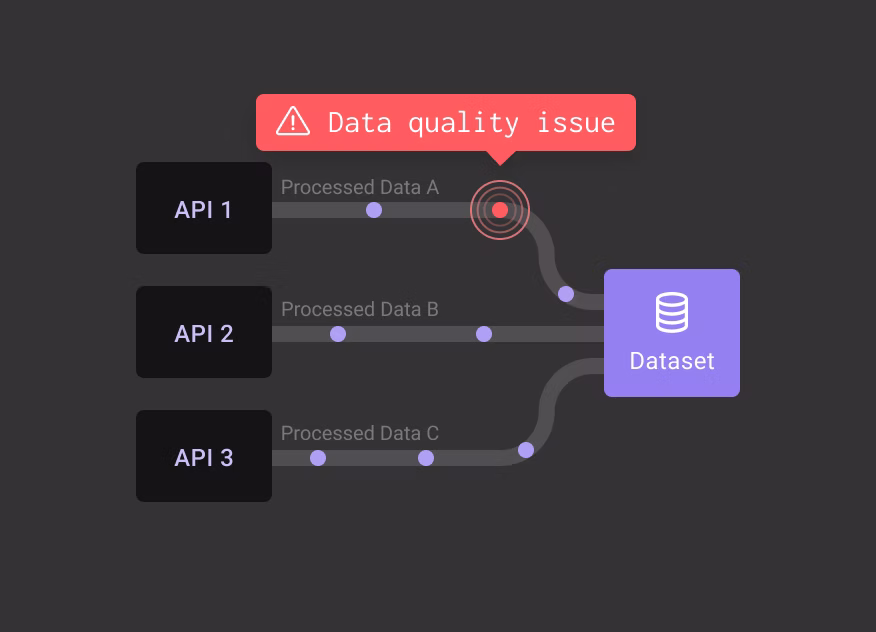
The new alert creation started with a request that kept returning from users at that time. They wanted to know when something is wrong with their data quality. Users wanted to be notified whenever there is an issue with data inside a specific dataset. For that, we needed to add an advanced alert monitor, checking the data source or pipeline process which is relevant.
What does a Data Quality Issue mean?
A possible indication of problematic data is when there is an issue with any of the metadata metrics like data freshness, null count, anomalies, and data statistics. A problematic data might be ingested into the target dataset undetected, and in turn affect downstream data products.
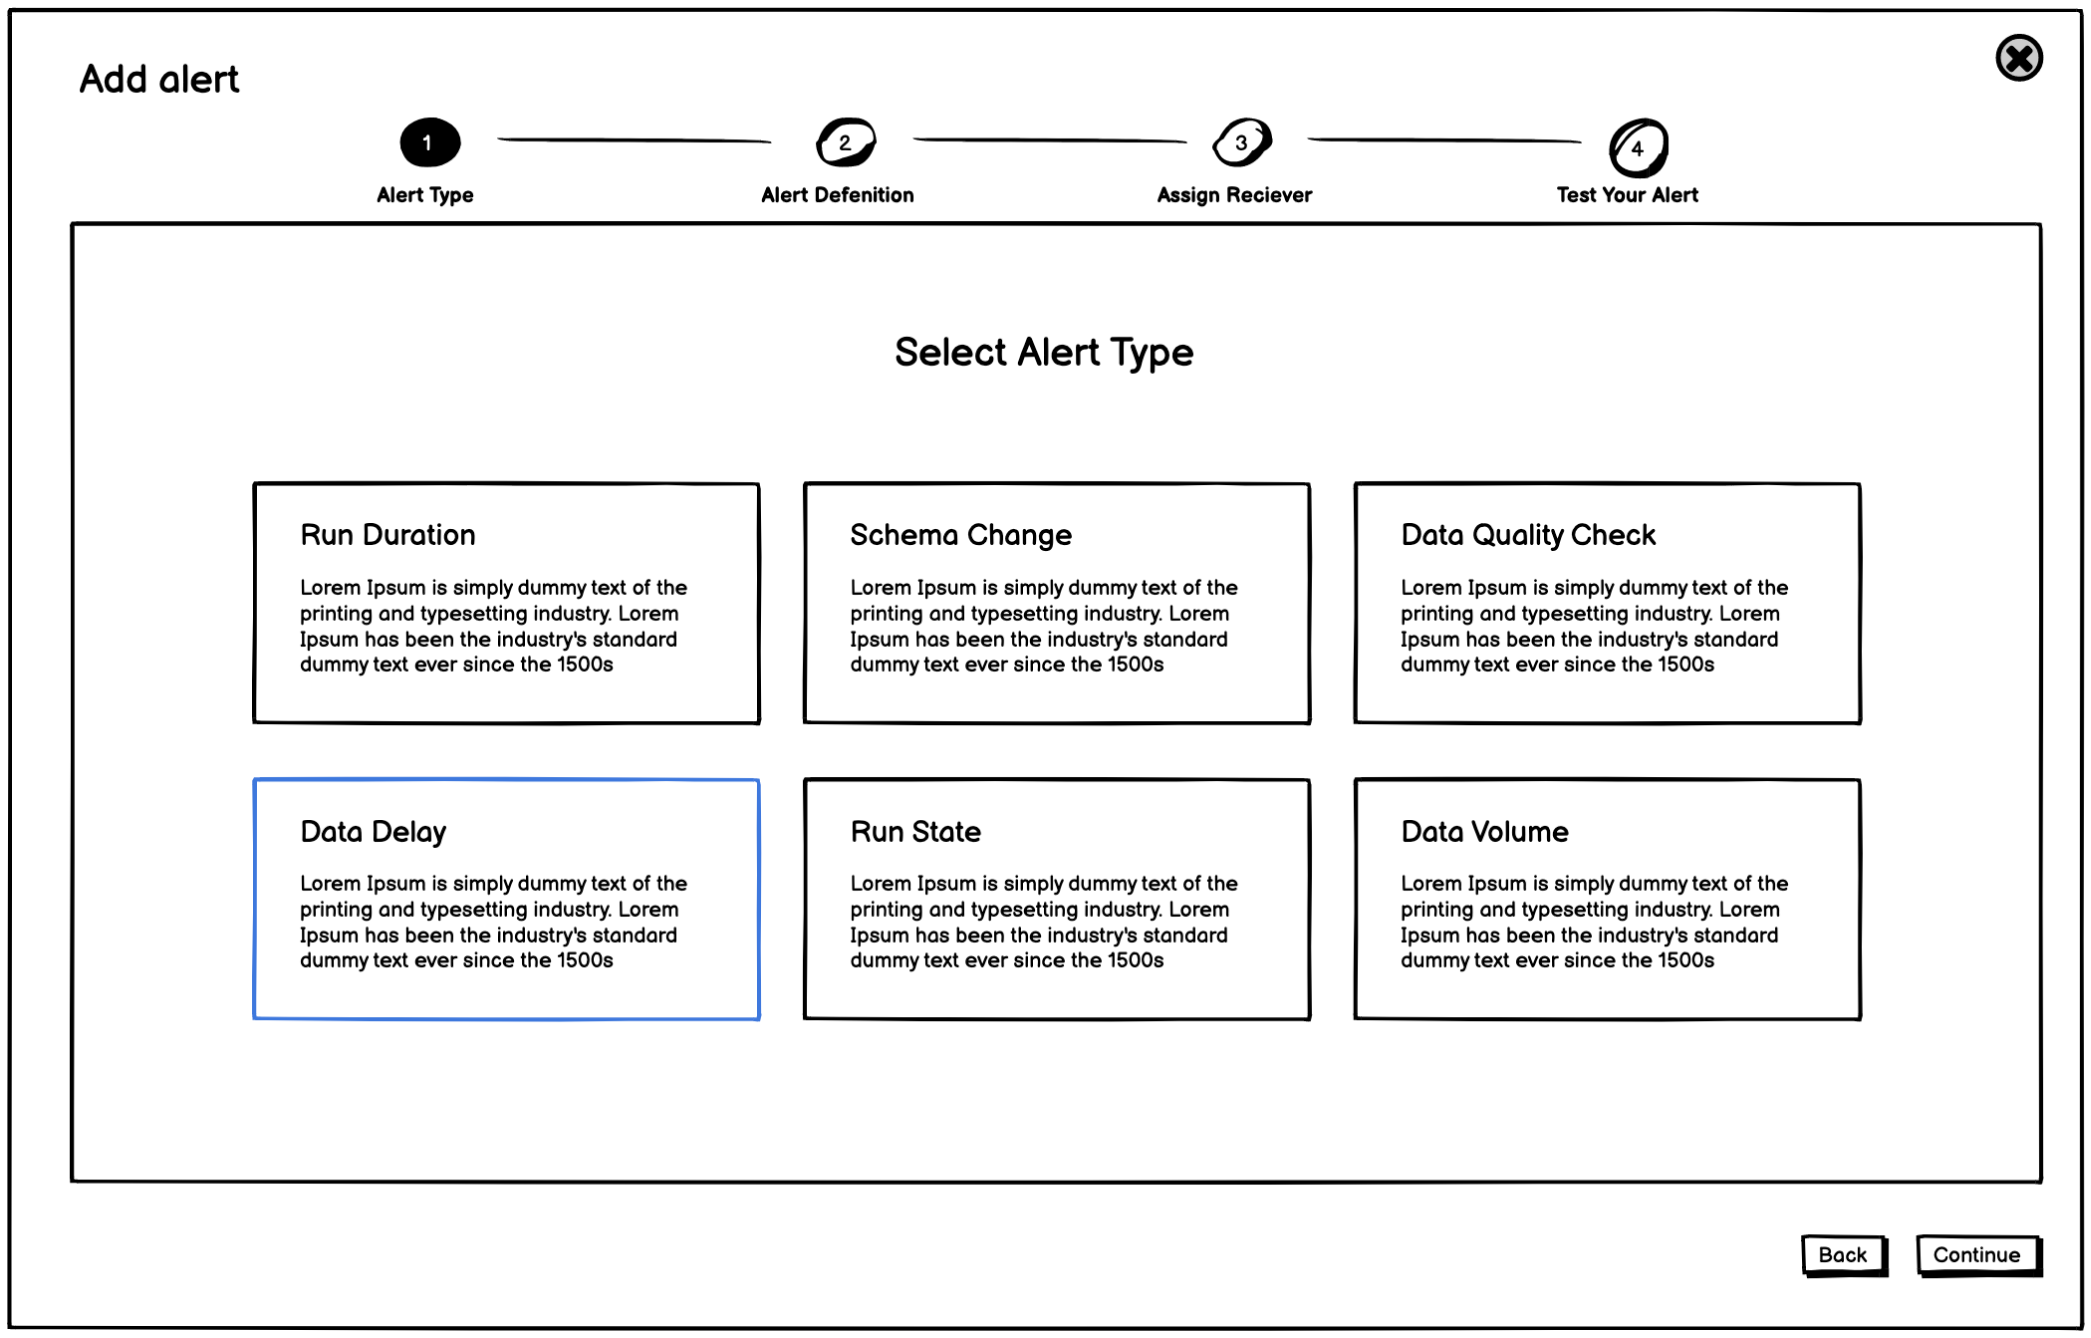
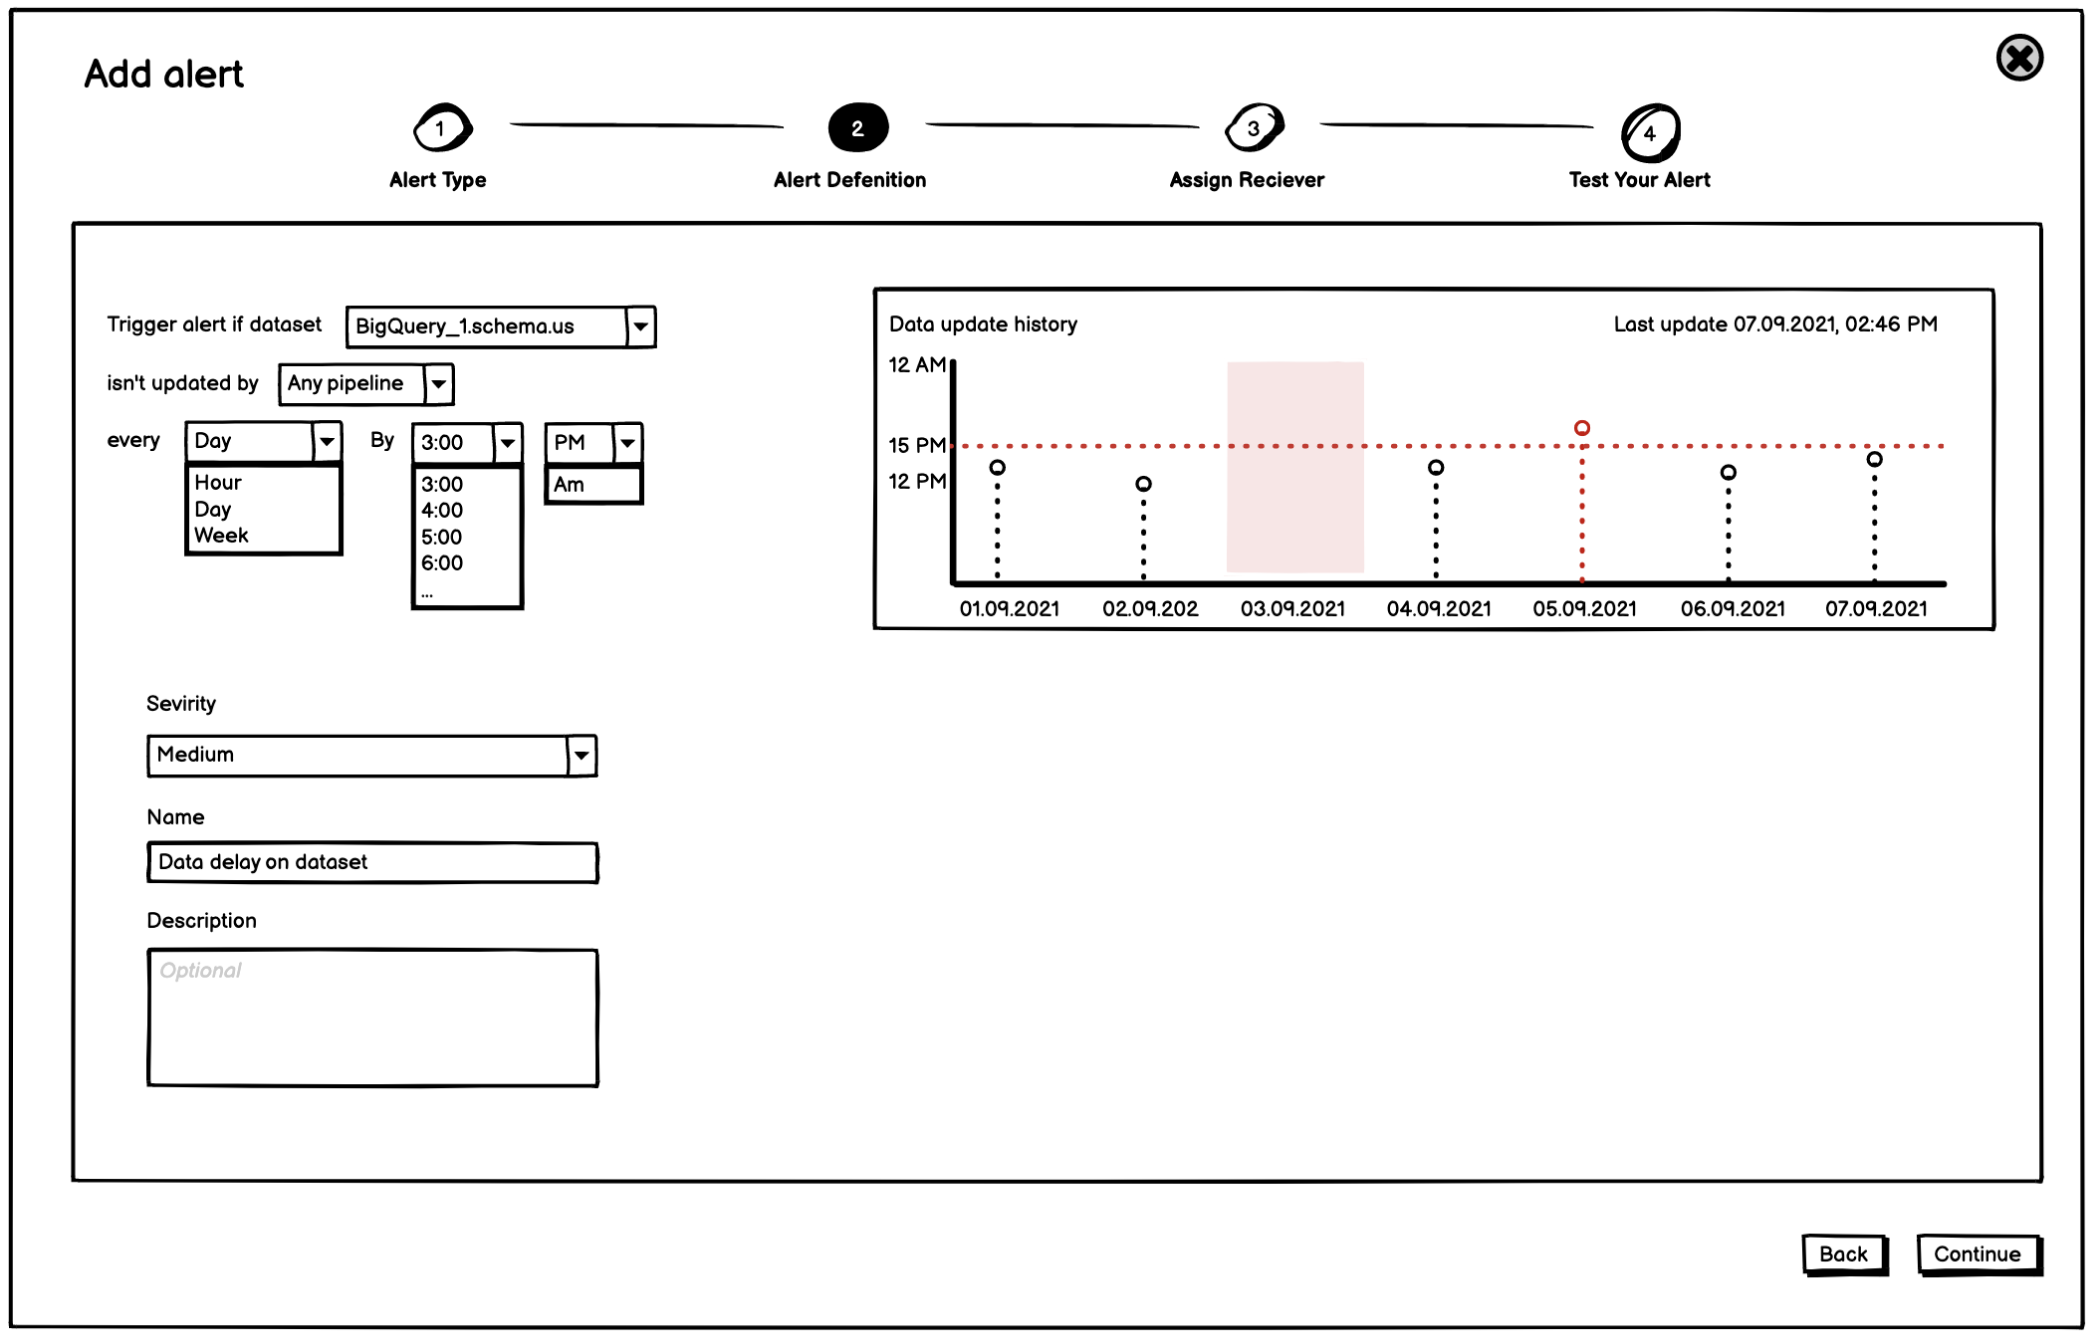
Starting with Data Delay Alert
Talking to users, we realized that knowing when data is late to be updated gives them a lot of value in indicating that something is wrong. For that we decided to allow users to set a Data Delay alert across multiple datasets, including the option to target datasets related to a specific pipeline.
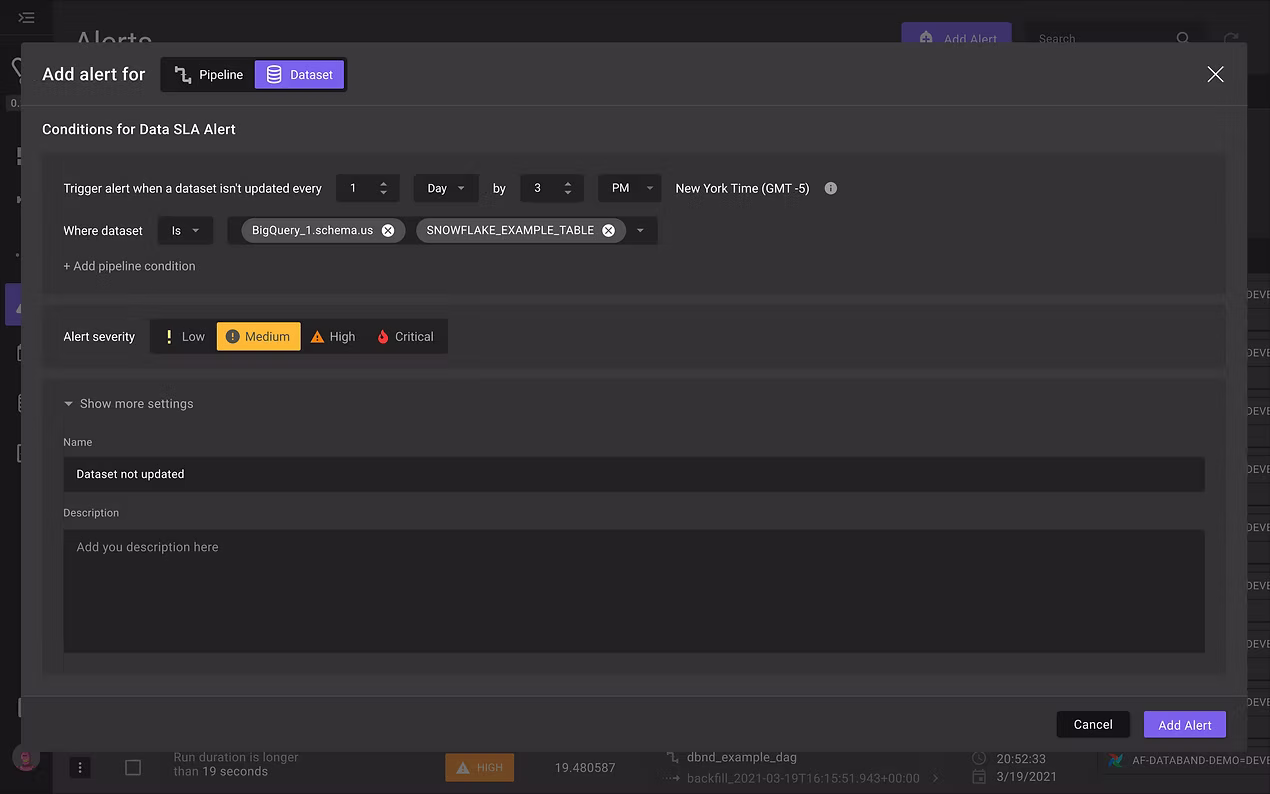
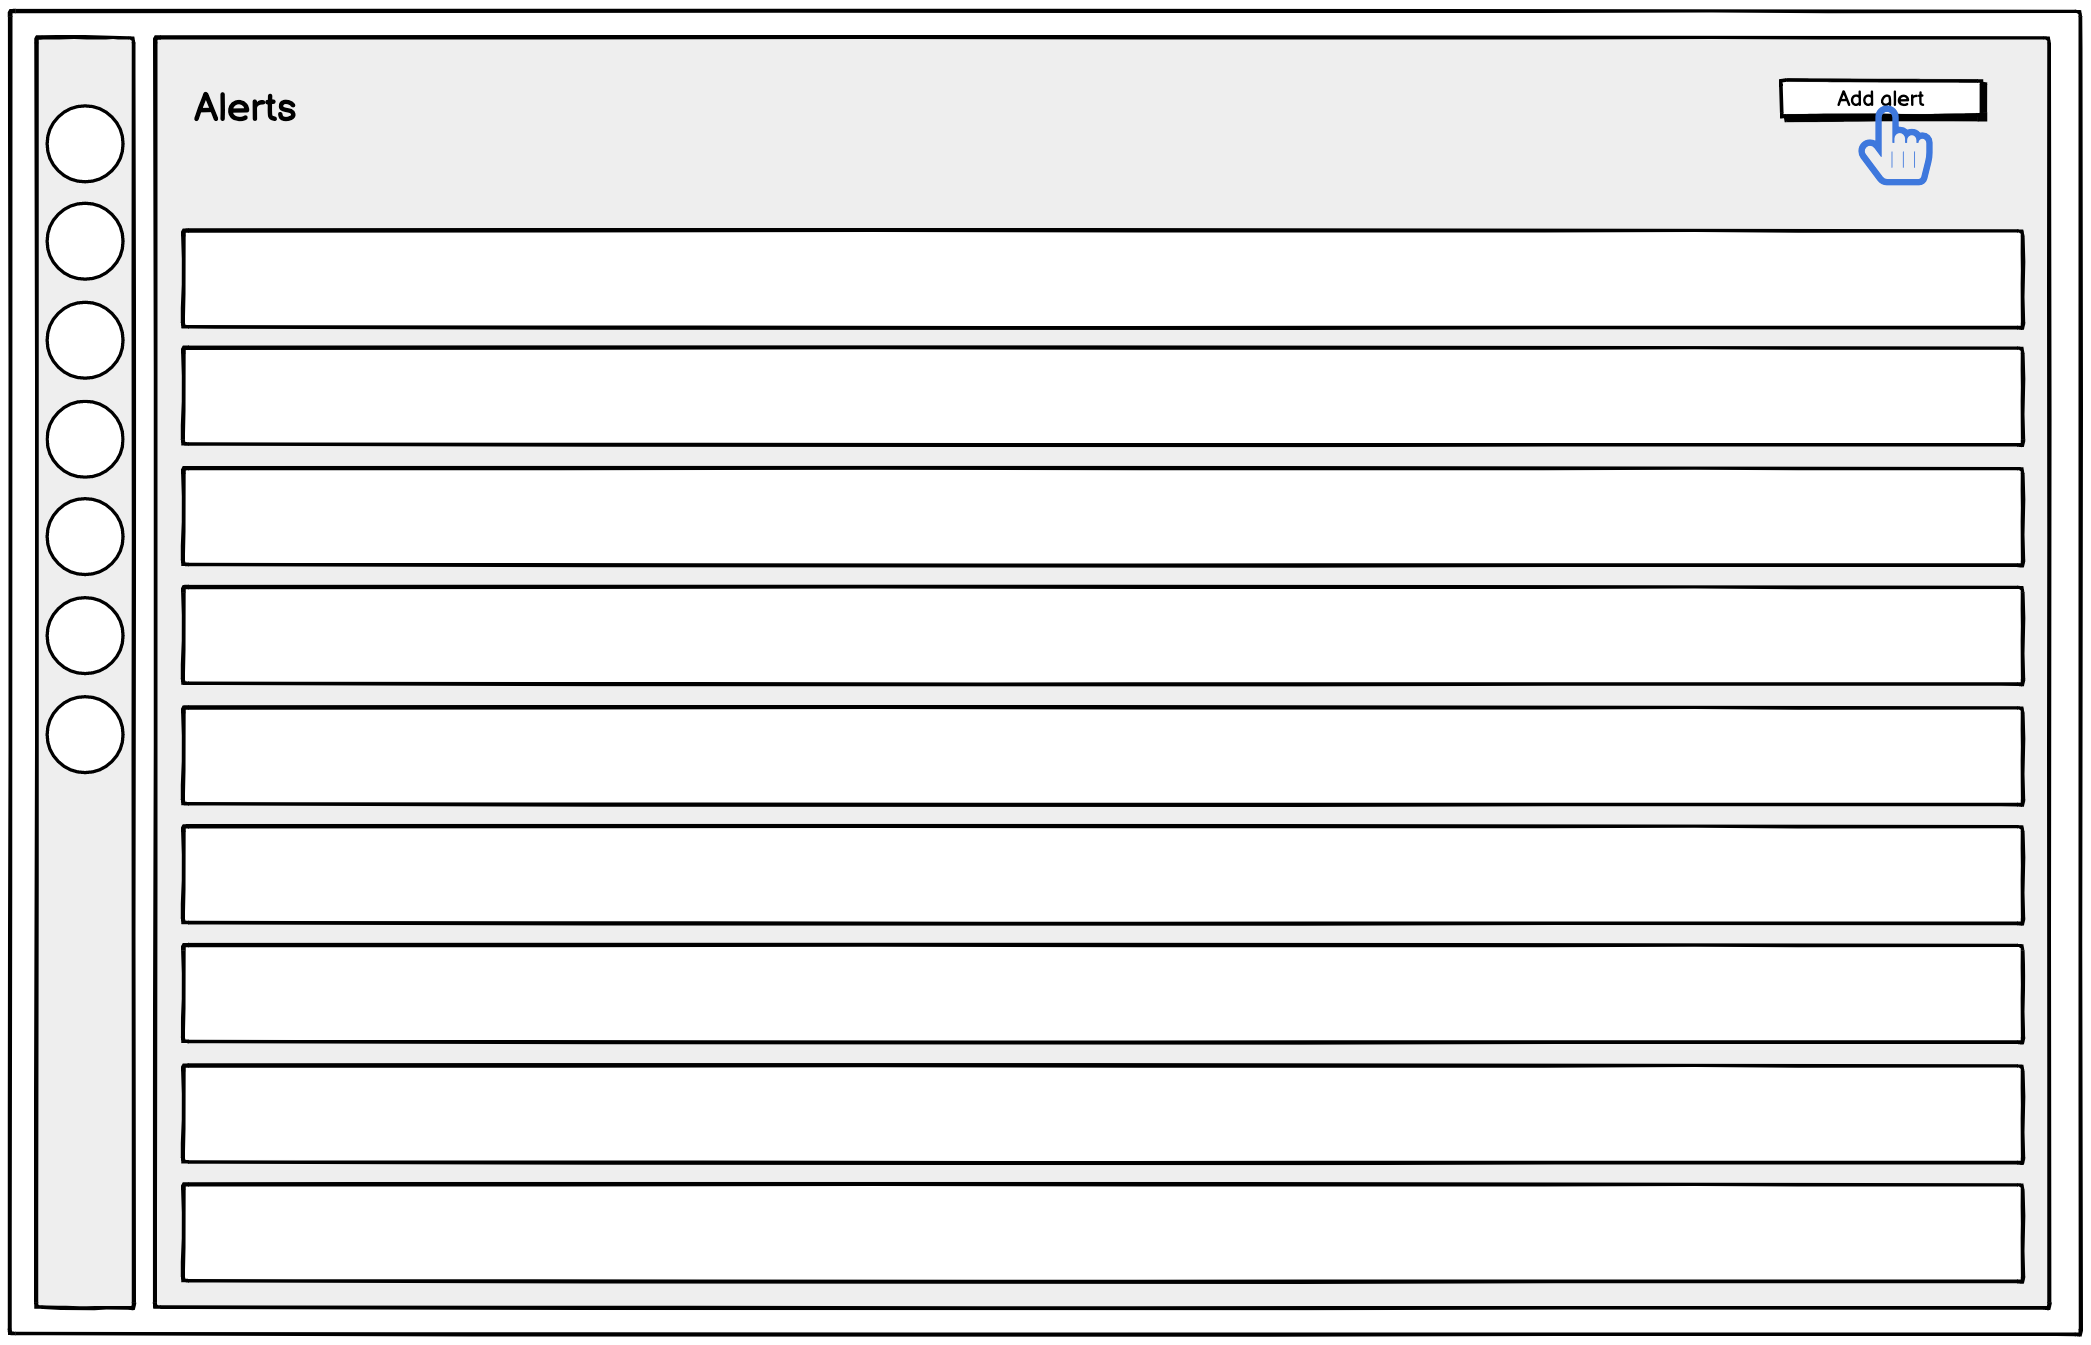
To begin with, we started by creating only the alert define experience without a receiver and no alerts gallery. We also temporarily left the old experience under pipeline alert. I created a prototype that would allow us to test the new alert experience with a few customers. It was pretty clear that the new design is easier to consume and much more clear than the old one.
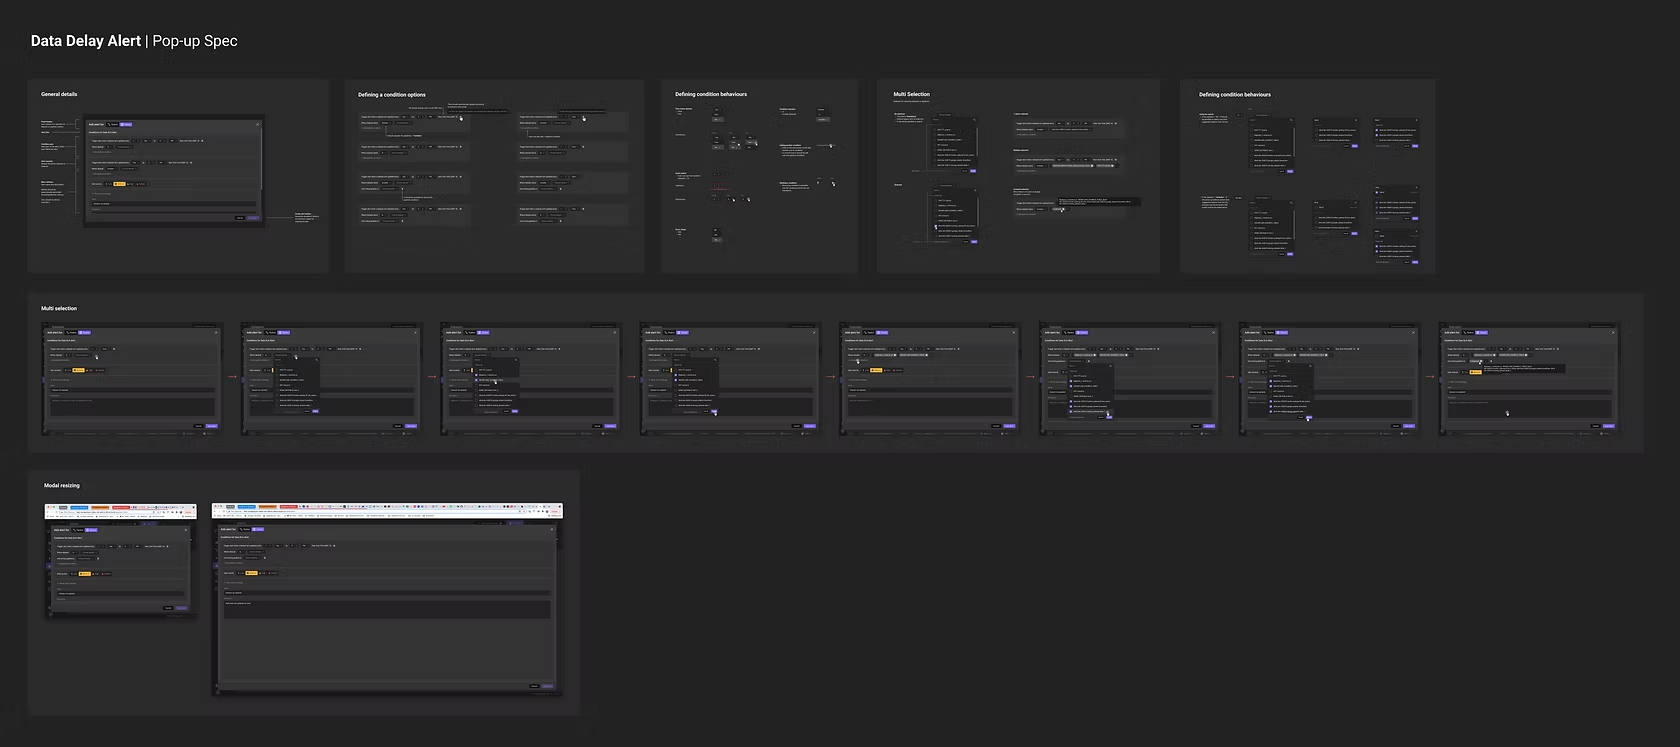
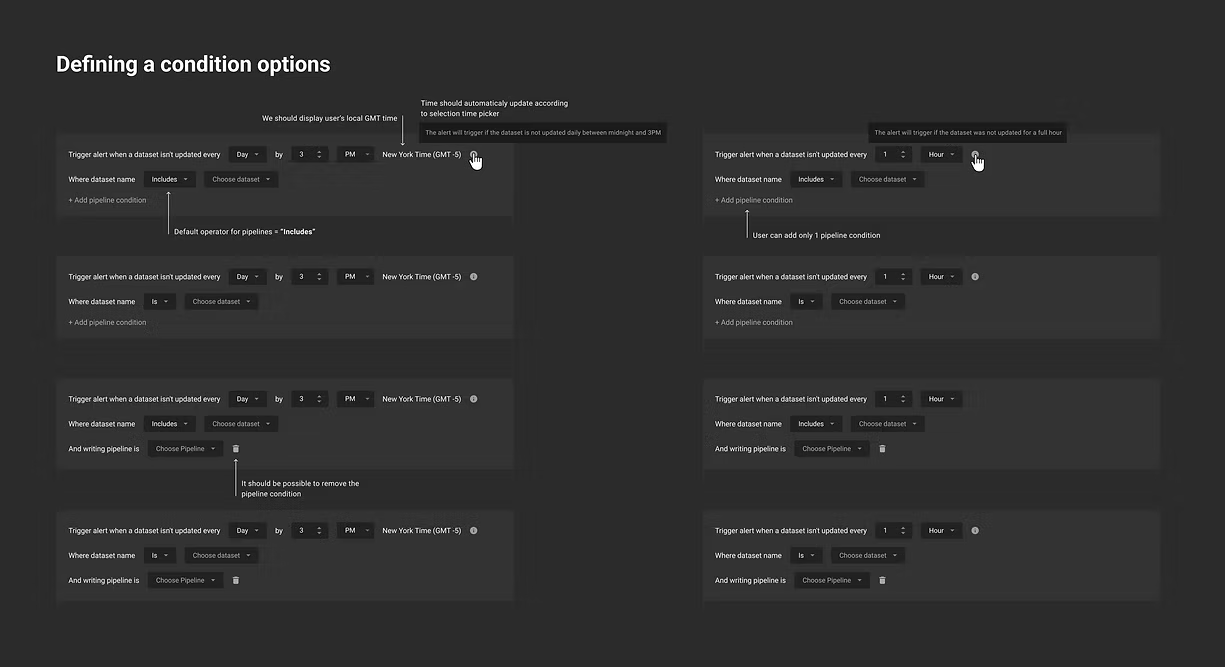
Preparing Design Spec for Development
I created detailed specs, presenting different use cases and flows, with high-fidelity design. Together with the front-end team, we defined different interactions and validation behaviors.
First Released Learning
Eventually, when the first iteration was on the air, we started collecting feedback from users.
Main good feedback:
- A conversational and direct new experience is more clear.
- The user's attention is focused on one alert.
- Setting an alert on multiple targets is super valuable for data engineers' workflow.
Need improvement:
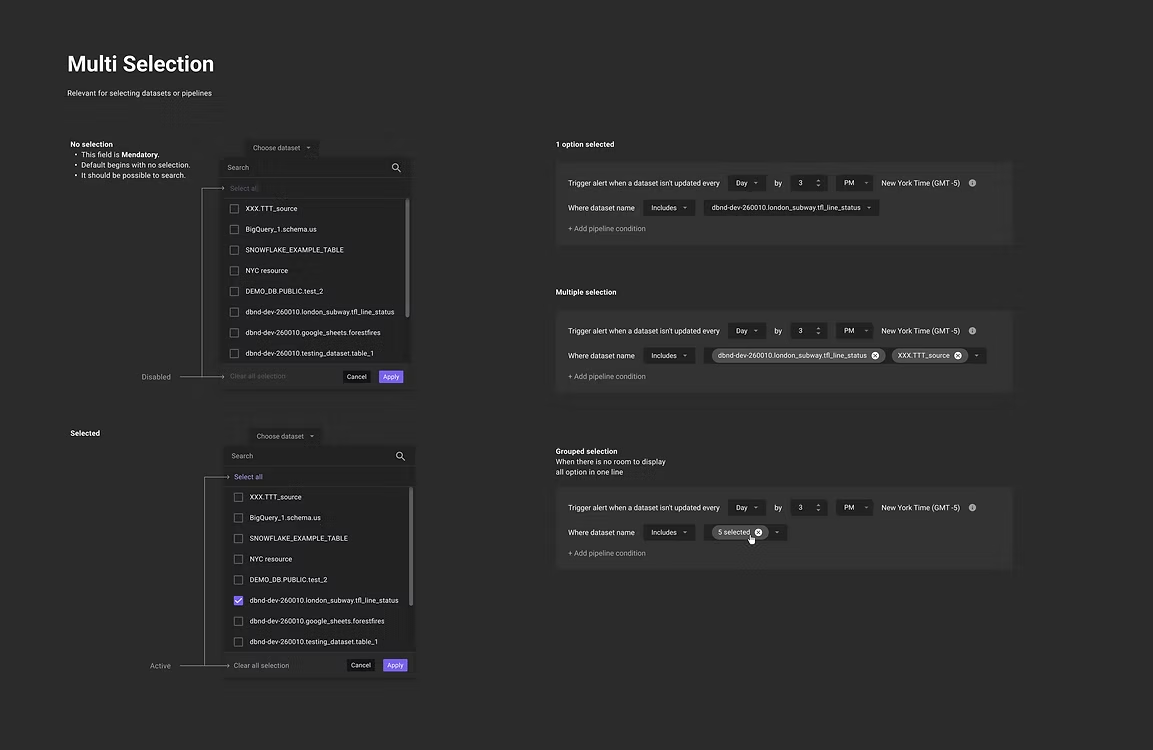
- Multi-selection dropdown interaction was confusing. Users couldn't understand the difference between them.
- Users wanted more details about how the alert is working.
I decided to address the feedback during the following iterations.
Iteration No.2
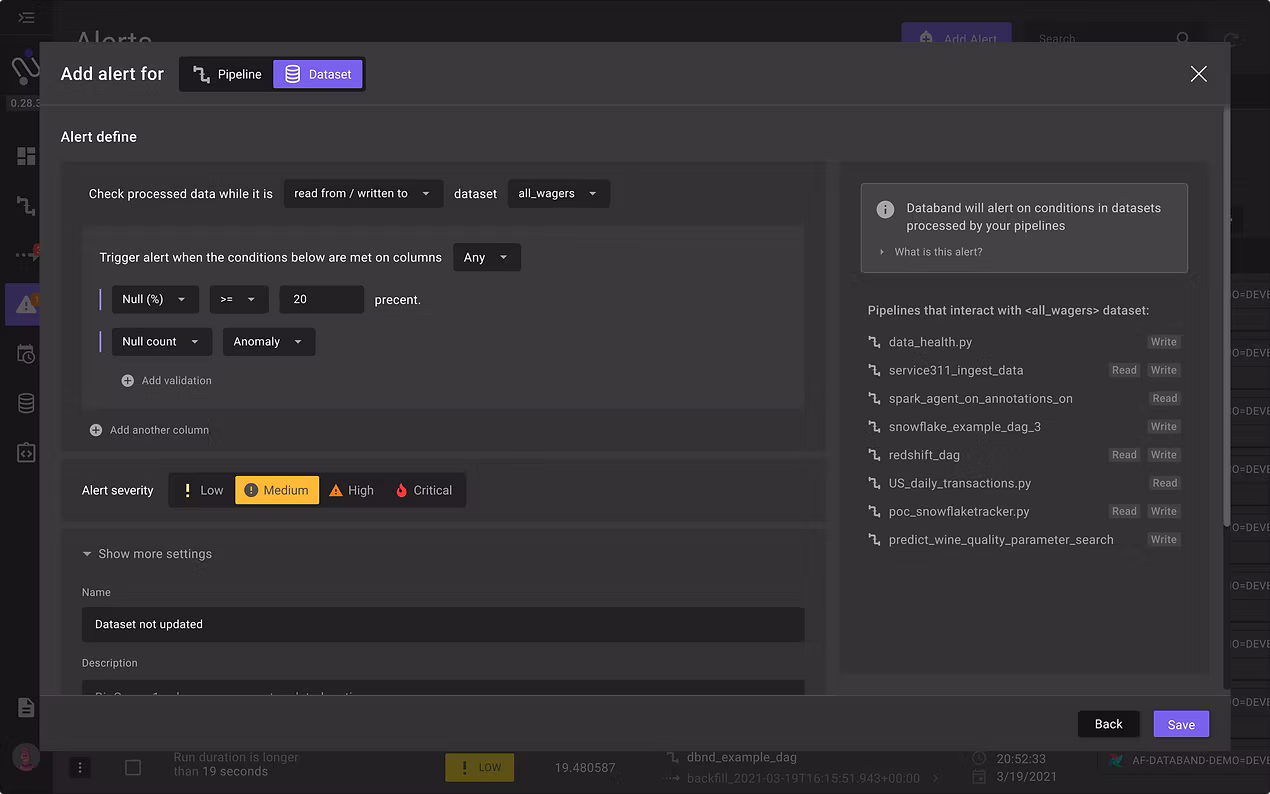
Data Quality Check
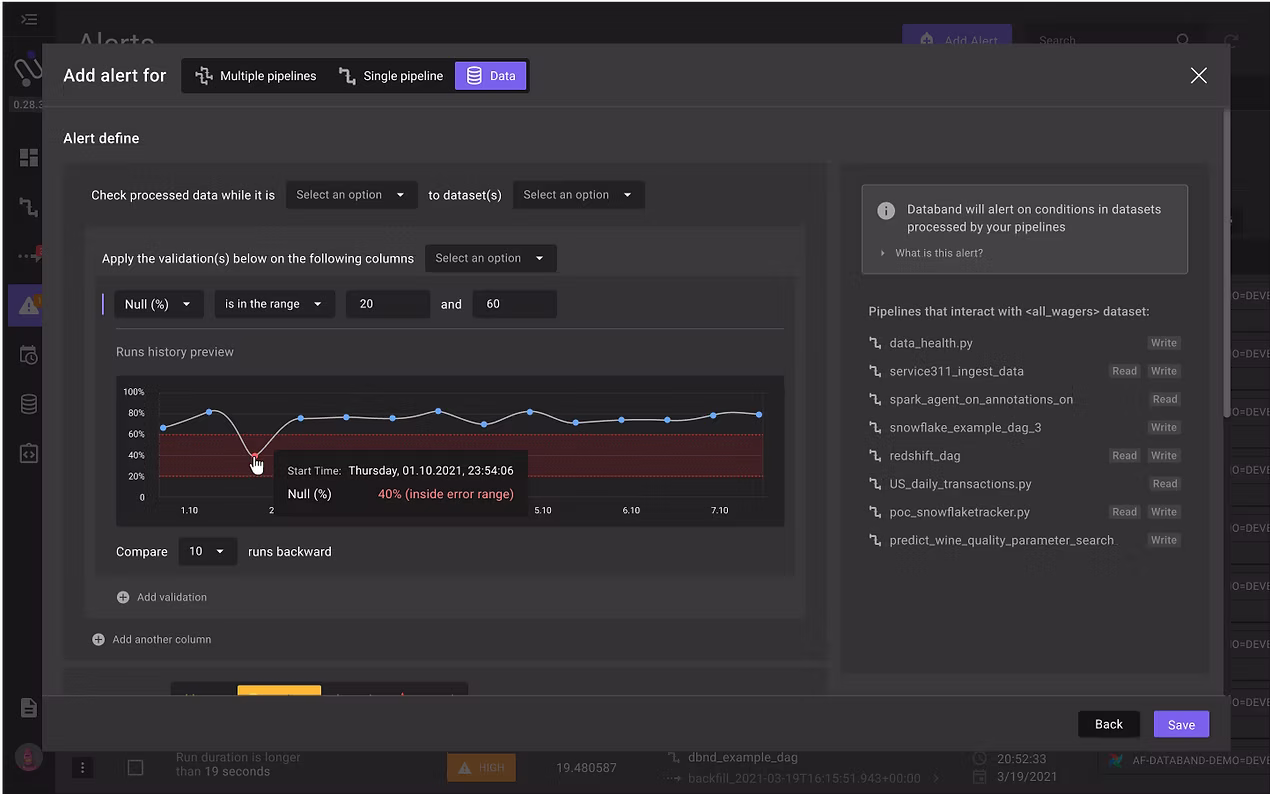
According to users' requests, the next iteration included the capability to set alerts on different metrics for column-level data. The new alert included setting alerts to one or more columns of a dataset, on different metrics like anomaly, nulls, and metadata statistics.
Users' Feedback
When users started working with the new data quality alert, we learned that users are missing 2 important things, that were scoped out because of technical priority:
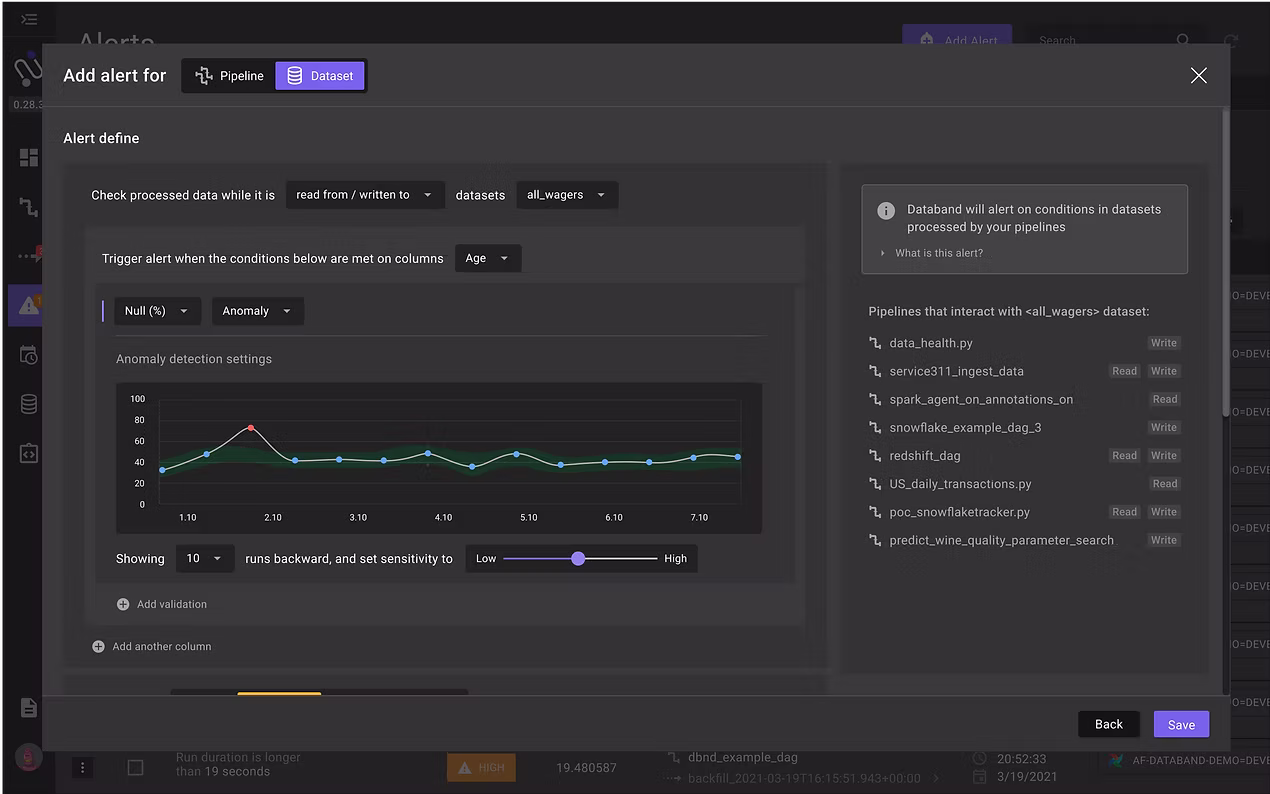
- Anomaly/Range detection - Users were looking for visual anomaly detection range, otherwise they can't really know what to expect from when an alert would be triggered. So we added a graph with anomaly detection, based on previous data that was collected.
- Alert on multiple datasets - Users were missing the ability to set an alert on multiple datasets at once.
Those requests were quite critical for users, so we invested the following sprint in adding those requests.
Iteration No.3
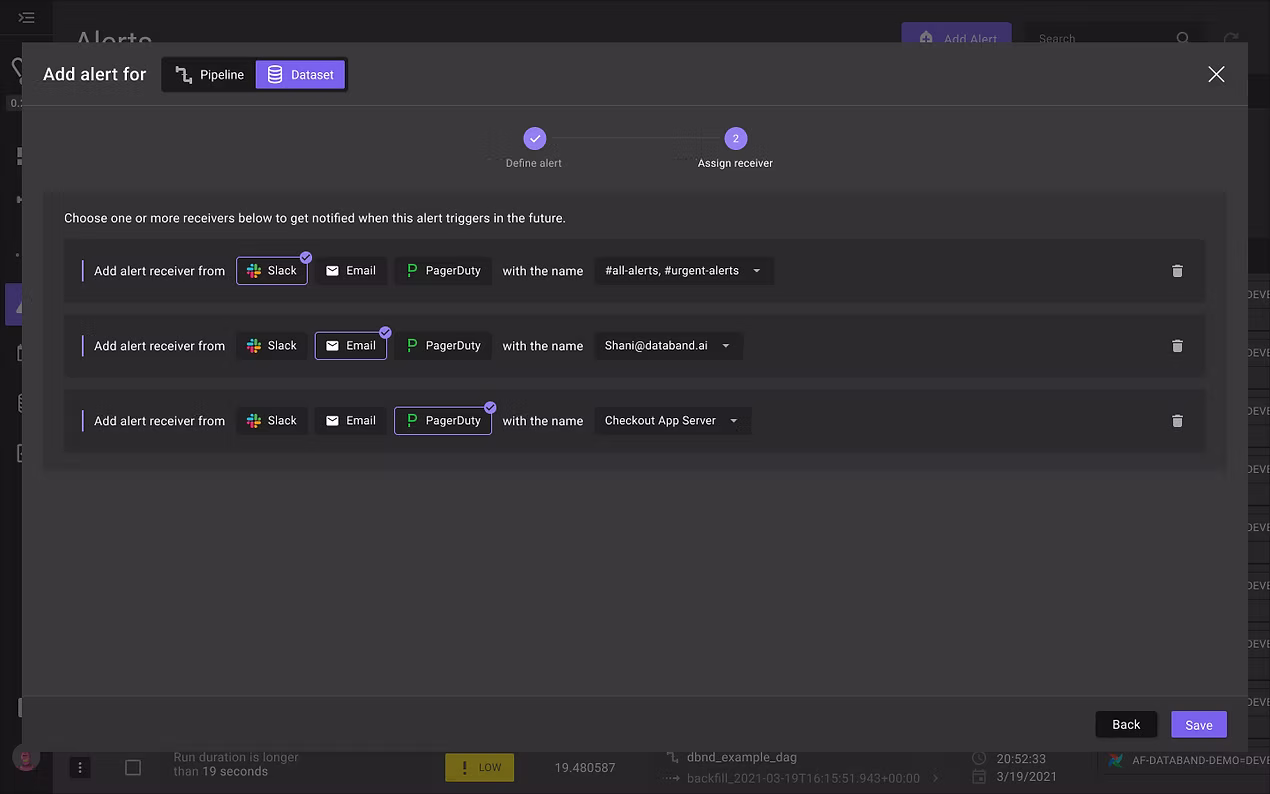
Choose an Owner / Receiver to be Notified
Now was the time to approach another step from the original concept - assigning different receivers for different alerts. Until this point, it was possible to set only one receiver for triggered alerts. The ability to choose different receivers per alert rule was a deal-breaker. Different people inside the same team or company were responsible for different pipelines, and they wanted to get only the triggered alerts relevant to them.
We took advantage to build this feature upon a request that came from an important client; adding integration for the PagerDuty receiver.
The experience was supposed to be very short and simple:
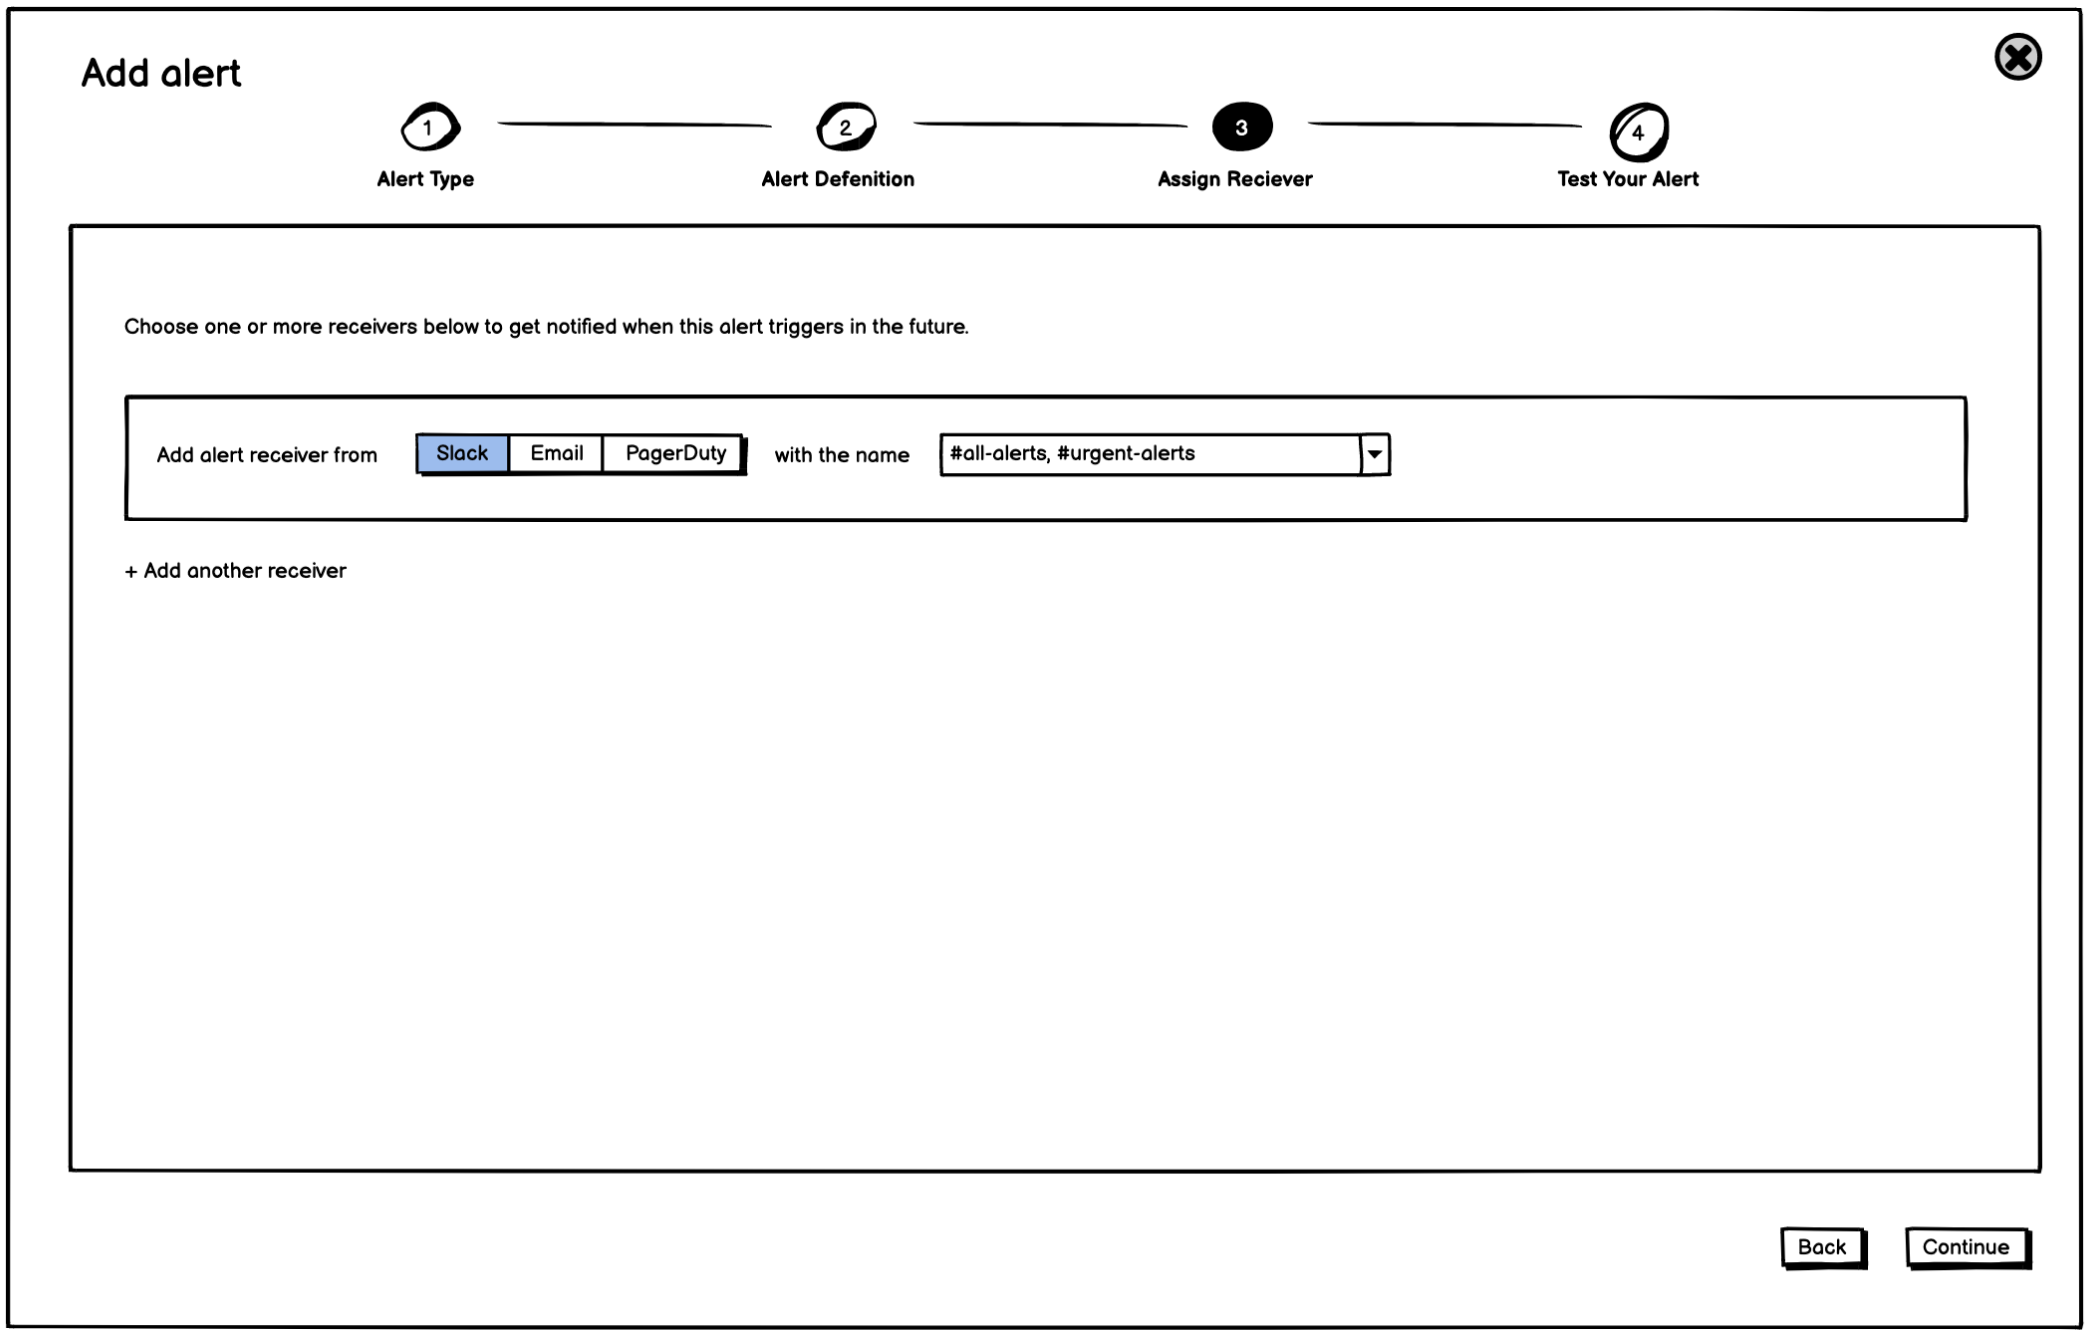
- Select one of the receivers that are integrated with the system - Slack, Email, or PagerDuty.
- Choose email, slack channel, or contact person, who would be notified.
Iteration No.4
Simplify the Experience for Assigning a Receiver
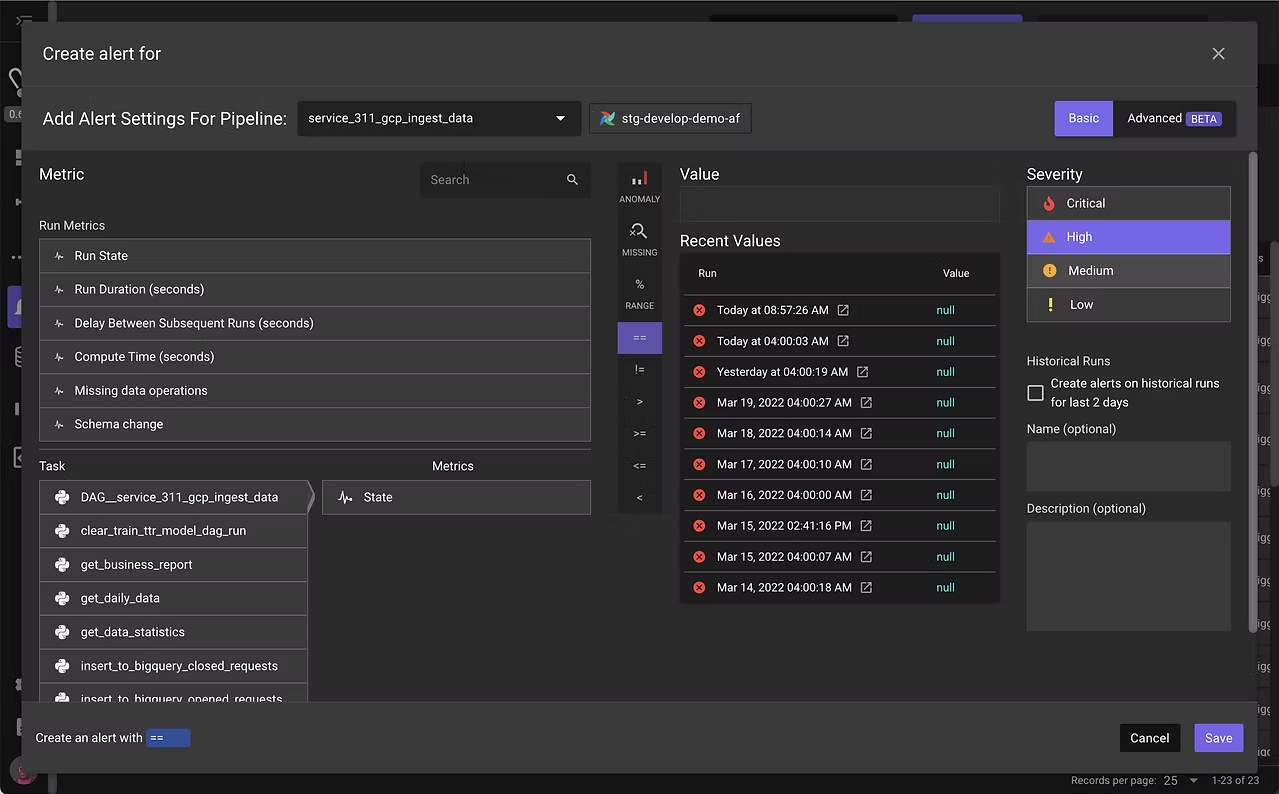
We quickly learned that the UI for selecting a receiver was really hard to understand, which ended up with customers not using it. We updated the experience into a list that exposes all possible receivers from the start, so the user only needs to choose which receiver they want notified.
Iteration No.5
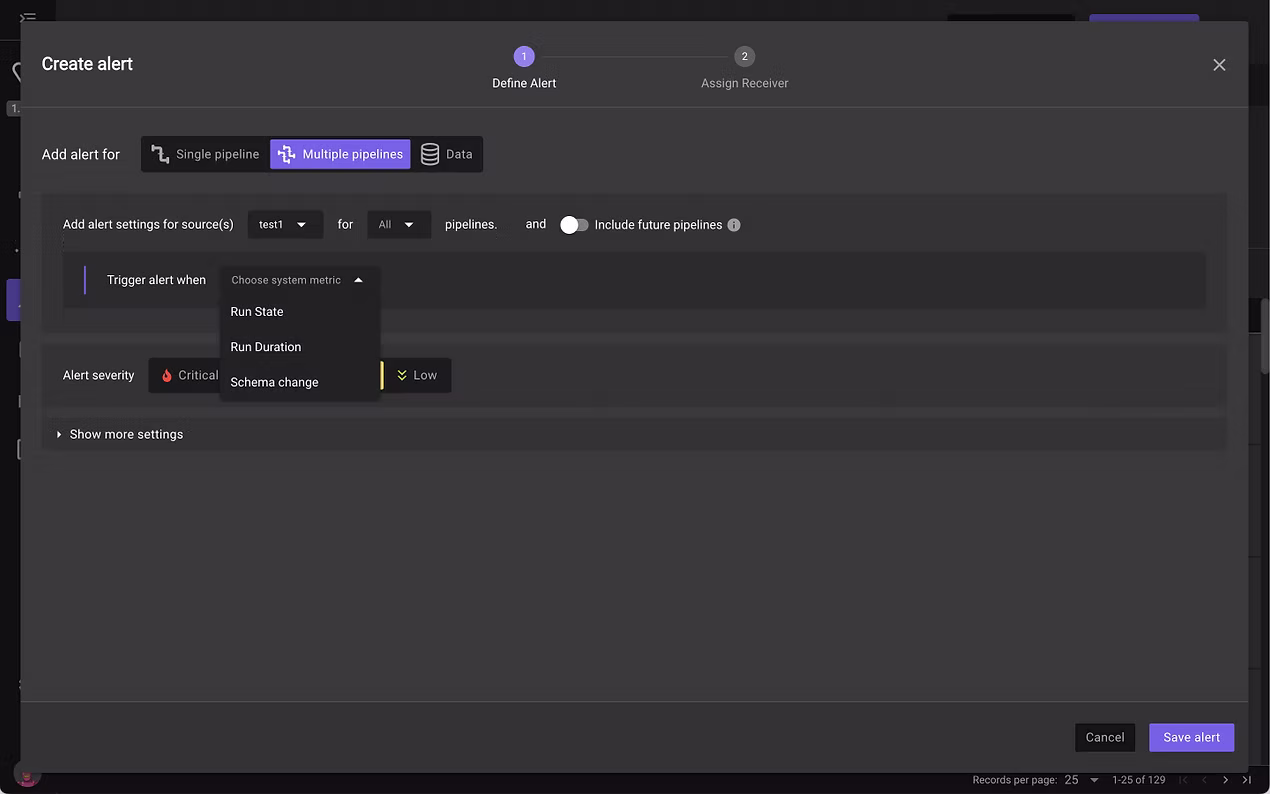
Creating an Alert on Multiple Assets
After introducing the ability to set a data quality alert on multiple datasets, customers asked for the same capability for the 3 most popular pipeline alerts: Run State, Run Duration & Schema Change.
We were looking for a quick way to validate and were wondering if to add multiple selections to the old alert editor, but we faced huge product and UX challenges that solving, would at least double our scope; the old editor supported setting an alert on specific tasks inside pipelines.

We knew that on our future road map we plan to solve the complexity of setting alerts on entire pipelines vs inner tasks. So for this iteration, we decided to add multi selections for those 3 alerts, using the new experience pattern. This would give us a quick solution that we can validate with users.
Iteration No.6
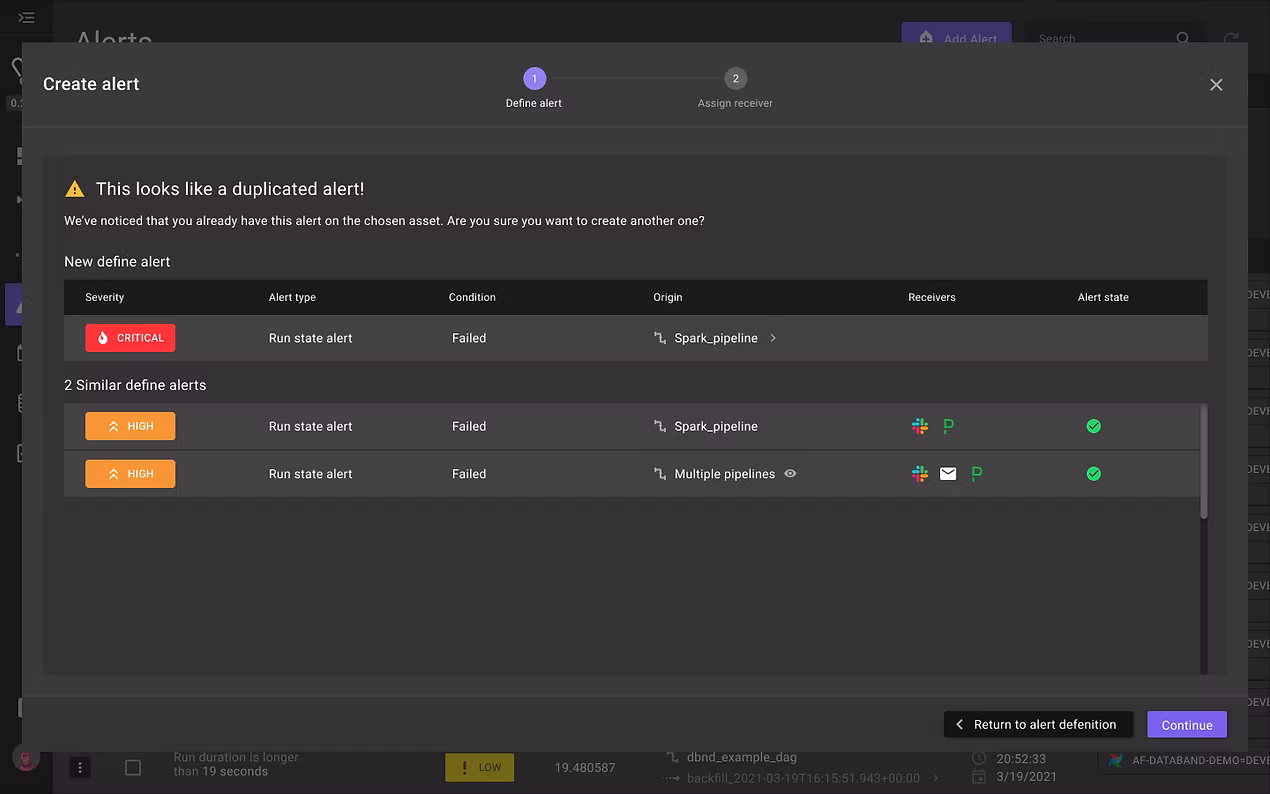
Users are Creating Duplicated Alerts
Our customer success team started to notice that for some reason customers are creating duplicated alerts. talking to them raised a few problems:
- They were receiving a lot of spam alerts, which ended up with ignoring some of the alerts or turning them off.
- The user didn't know if they or someone else has already set up an alert on a specific asset.
We realized that the problem was in our experience, which allowed creating similar alerts without warning the users that they are about to do so.
An alert considers duplicated if there is a similarity in 3 parameters:
- Alert type
- Condition
- Origin of assets
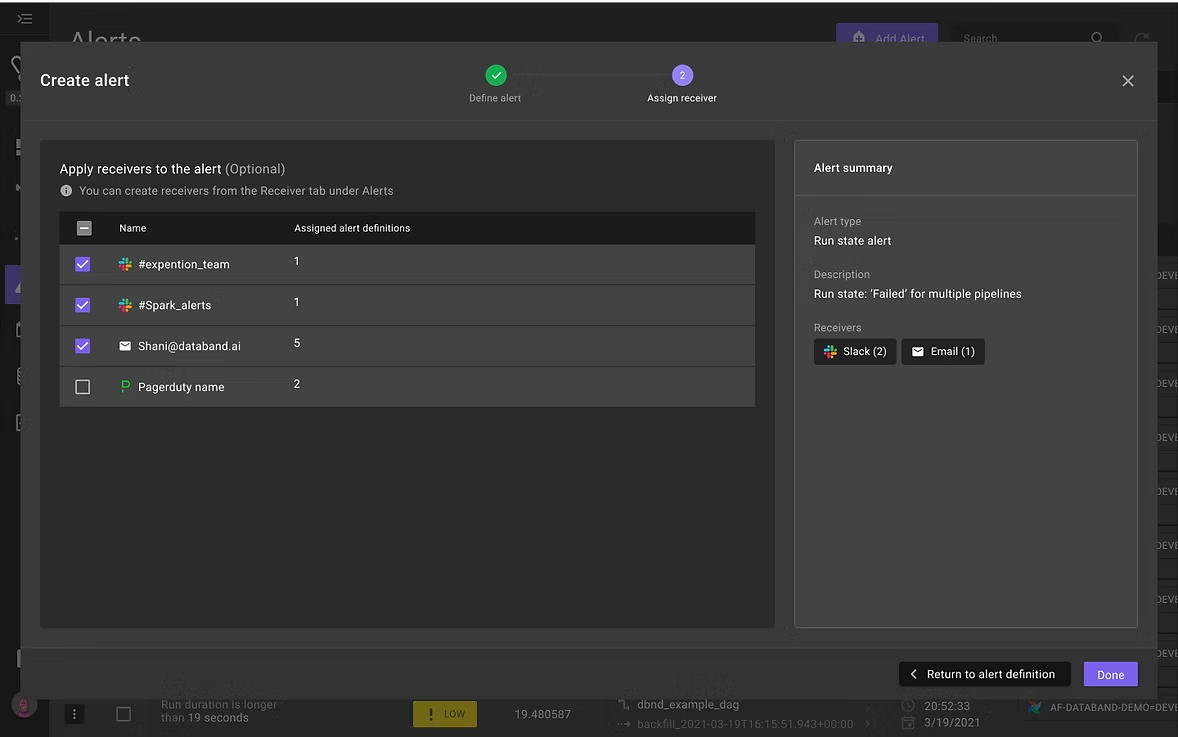
The solution
In case we recognize that the user setting an alert that is similar to existing, we show him as part of the create alert flow, a validation screen which warn him that he is about to create a duplicated alert, and present him details about those alerts.
Iteration No.7 (WIP)
Creating an Alert for Multiple Assets
Lately, we working on unifying the entire alert experience, and tackling more of the major problems in alert creation products.
Product requirements:
- All alerts on pipelines should support the complexity of setting alerts on the entire pipeline vs alerts on inner tasks.
- All alerts should be applied to single or multiple assets.
UX requirements:
- Users should understand what the alerts suppose to test, and giving 1 or more examples.
- 1 coherent experience for all alerts - Today it includes 3 different experiences with different capabilities.
- Old experience is confusing, not clear, and not friendly to use.
- The conversation UX pattern is not optimized for the localization of different languages.
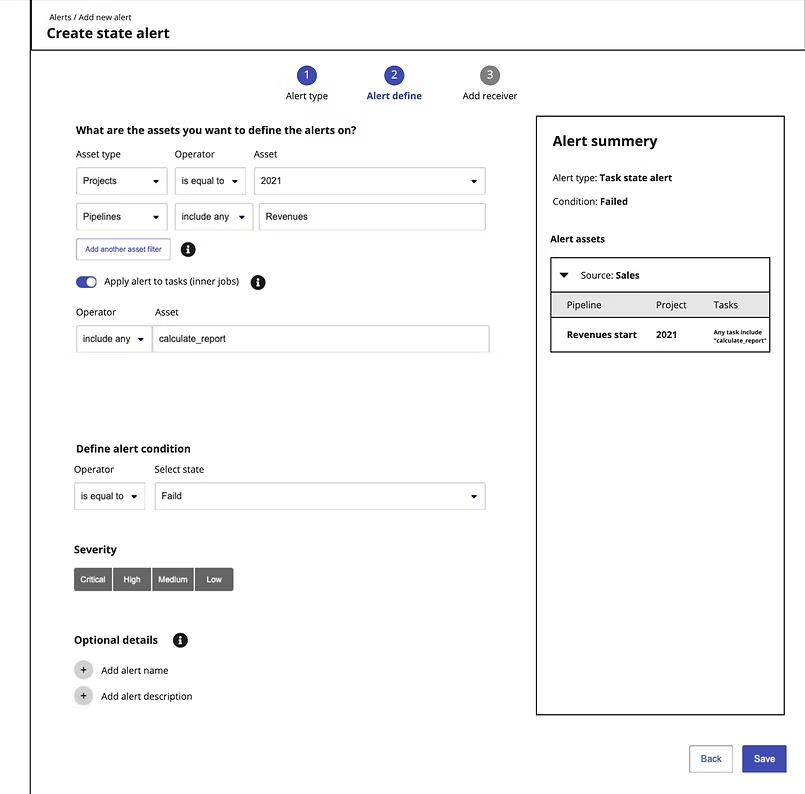
Assumptions we had:
- User wishes to filter according to source or project, might be both of them together.
- It is important the user would know from the start if he sets an alert on the entire pipeline or on tasks level.
I create a low-fidelity mockups in order for the product manager and I are could explore and refine different ideas, and use cases, and collect feedback from customers. Each version starts with assumptions that we validate with customers.
You can see a prototype example for one of the latest concepts.
Note: This version is still in the ideation phase.
Usability feedback
We tested this version with our customers, and we learned some good & bad insights.
The good feedback:
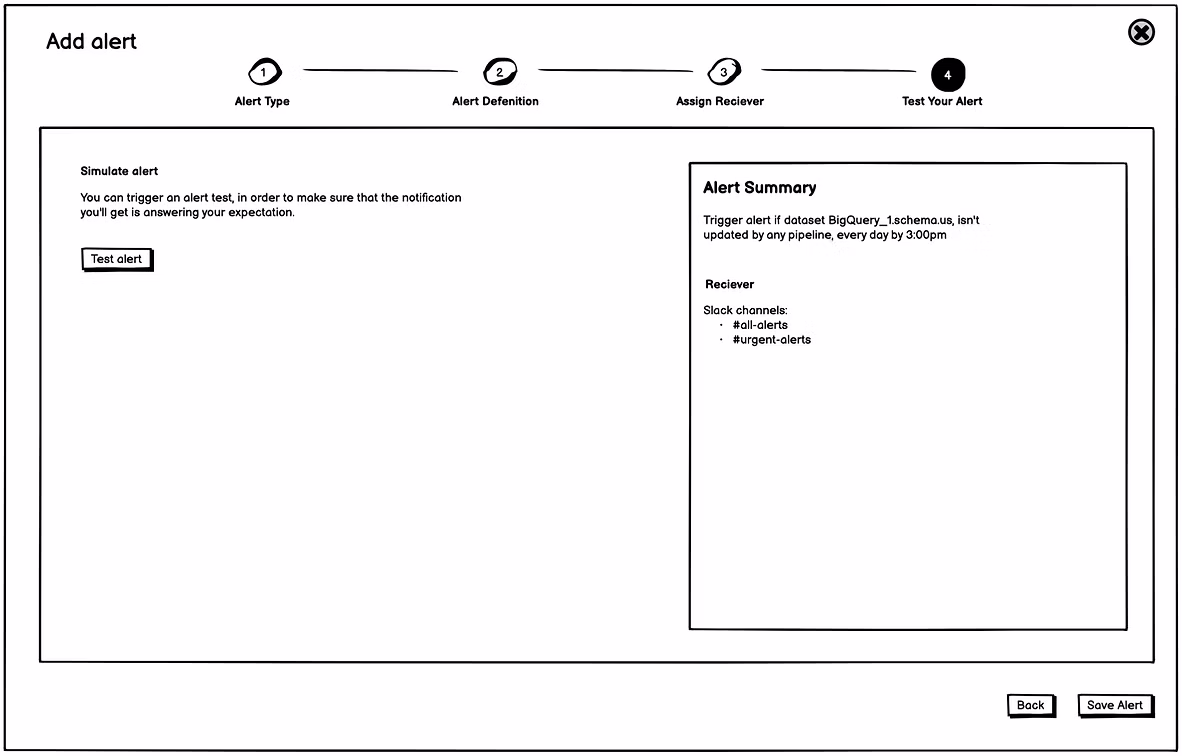
- People loves the Summary part, "Setting an alert can be complicated and it is good I can see it all the time"
- The gallery which explain the alert and it is good there are some use cases examples.
Less good insights:
- Sometimes people missing that they need to choose if setting alert to the entire pipeline or to inner tasks.
- Even when users are not missing this option, they are not always understand what the different.
- Filter pipelines assets according to source and projects together is confusing. Seems that this is not useful scenario.
Adopting the feedback
After the testing we did, we understood the we need to update a little our assumptions:
- If the user wishes to filter according to source or project, he probably wishes to create alerts on the level of pipelines or any tasks of one or more pipelines.
- The user would probably filter according to projects or sources, but not both of them.
- Setting task alerts is derived from the context of specific pipeline.
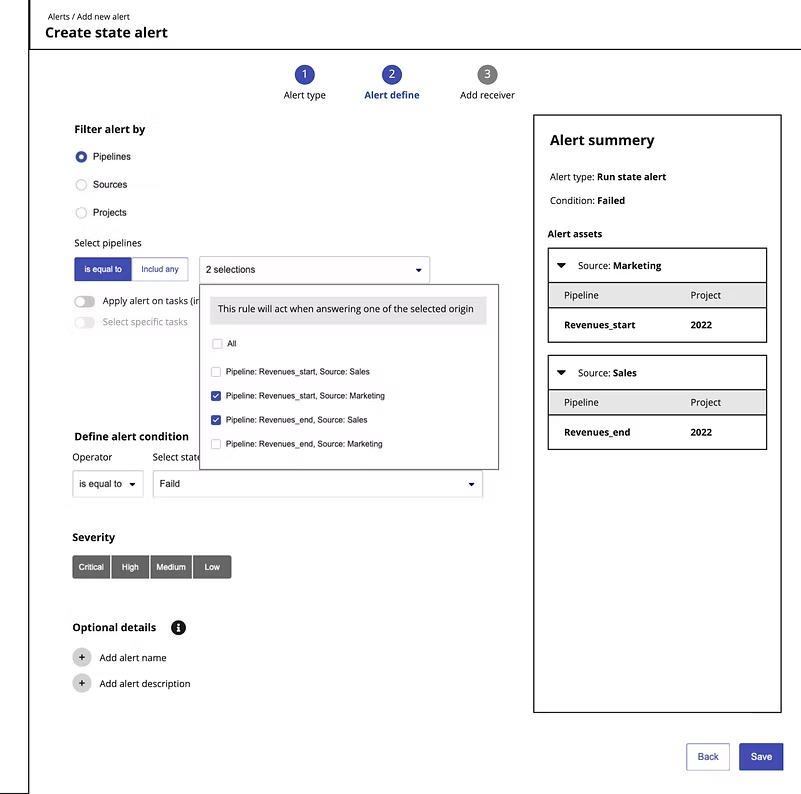
UX changes:
- A user is asked to filter from the start according to source, project, or pipeline.
- Then we asked him about asset selection.
- Applying an alert to a specific task is optional only when selecting a specific pipeline. The user needs to toggle on the options related to the tasks.
- It is not possible to cross-filtering according to source & project together.
Outcomes
What Changed
Over 7 releases, the alert creation experience went from one of Databand's most painful interactions to a self-serve workflow that data engineers could complete without customer success involvement. Key outcomes:
- Alert types grew from a single pipeline alert to a full suite covering data delay, column-level quality, anomaly detection, multi-asset selection, and per-alert receiver configuration.
- The conversational, step-by-step pattern significantly reduced cognitive load - usability testing showed users understood the new flow immediately, compared to needing guided support with the original.
- The duplicate alert detection (Iteration 6) directly reduced alert spam and the CS tickets that came with it - customers were turning off alerts because they were getting too much noise.
- Multi-asset selection, introduced in Iterations 2 and 5, unlocked a workflow that was previously only possible by creating alerts one at a time.
Reflection
What I Would Do Differently
The conversational UX pattern was the right call for simple, single-asset alerts - users responded to it immediately and it tested well. But as the product grew to support multi-asset scenarios, pipeline-vs-task hierarchy, and per-alert receivers, the pattern started showing its limits. We ended up with three different experiences that each solved a piece of the problem but didn't feel like a coherent system.
If I were starting from scratch, I would have invested more time upfront in designing the mental model rather than the interface. The core question - "is this alert about a pipeline, a task inside a pipeline, or a dataset?" - was something users consistently struggled with across every iteration. Getting a cleaner answer to that question early would have shaped a more extensible foundation and saved several rounds of rework.